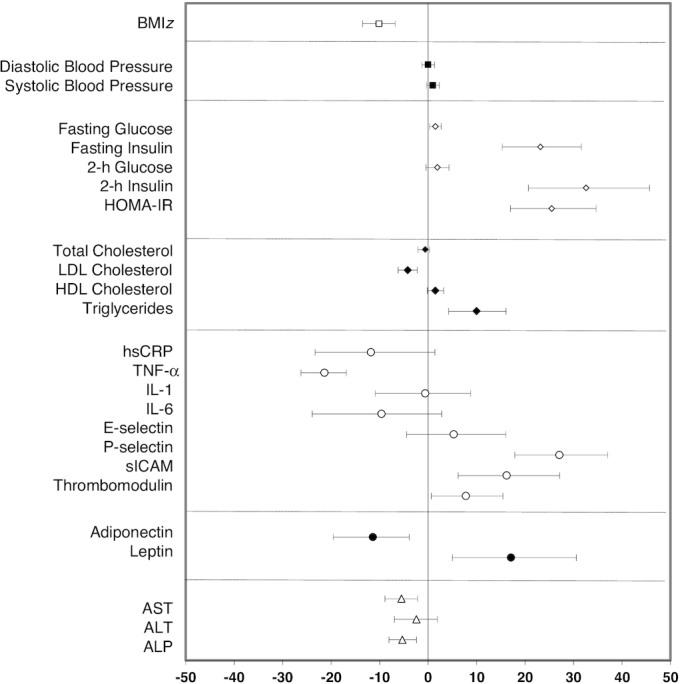
FIGURE 2.

Pooled 1-y change in CMRFs. For each individual CMRF, the mean percentage difference is plotted as the symbol and the 95% CI is displayed as the bar. The mean percentage difference values and 95% CIs are derived from least-square means calculated from a mixed-effects random intercept model with time (baseline or 1 y) as a fixed effect and a random intercept for subject correlations. A separate model is fitted for each log-transformed outcome. Numbers of children in the SC and SC + enhanced program groups with both baseline and 1-y values were as follows: BMIz (n = 317); blood pressure (n = 270); glucose metabolism (n = 264); lipid profile (n = 265); hsCRP (n = 261); other inflammatory, vascular adhesion, and coagulation markers, and adipokines (n = 221); and liver enzymes (n = 268). ALP, alkaline phosphatase; ALT, alanine transaminase; AST, aspartate transaminase; BMIz, BMI z score; CMRF, cardiometabolic risk factor; hsCRP, high-sensitivity C-reactive protein; sICAM, soluble intercellular adhesion molecule.
