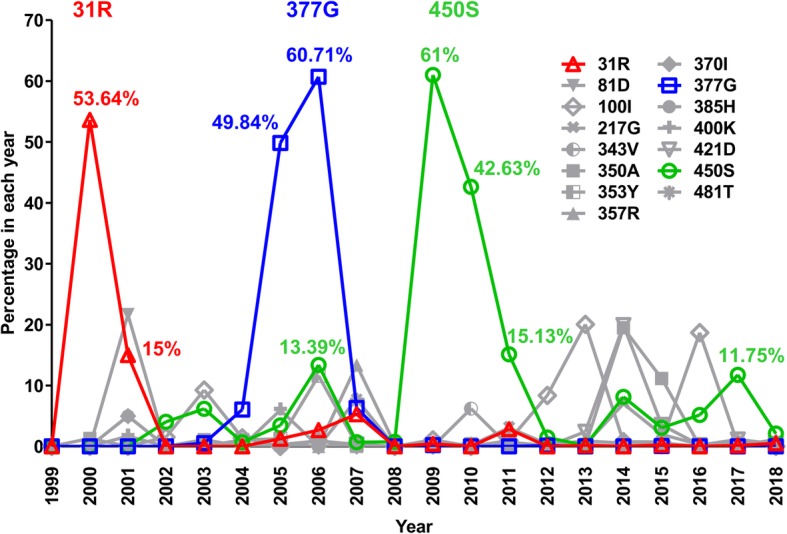
Fig. 2.

The 31R, 377G, and 450S substitutions showed higher ratio in specific years. Residues defined as sporadic mutations in Table 1 were further calculated their percentage in total global sequences in each year from 1999 to 2018. The percentage of more than 10% of residues 31R, 377G and 450S were labeled (31R in red, 377G in blue and 450S in green). To easily observed the curve of 31R, 377G and 450S, all other residues colored in gray but with different symbols
