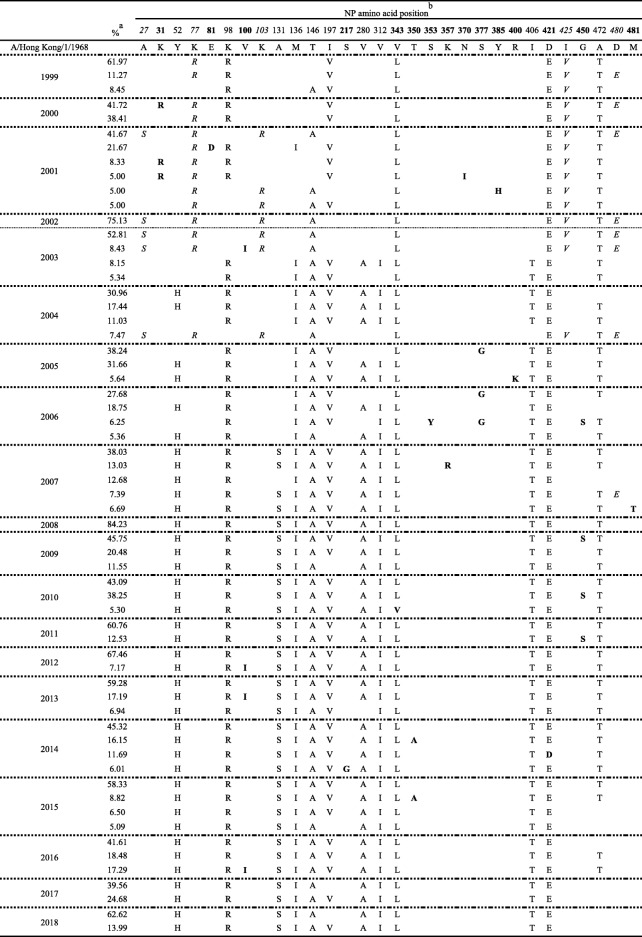
Table 1.
The dominant NP amino acid sequences of each year from 1999 to 2018
aThe sequence types, their number and the proportion to total sequence collected in the same year were analyzed and calculated. Only percentage over 5% in each year were listed in this table
bResidues in italic were those major observed from 1999 to 2003 especially in 2001–2003 and rarely identified after 2004. Residues in normal form were defined as conserved protein backbone especially since 2004 in longer time period while residues in bold were defined as sporadic substitutions during evolution (Please see the description in Results text)

