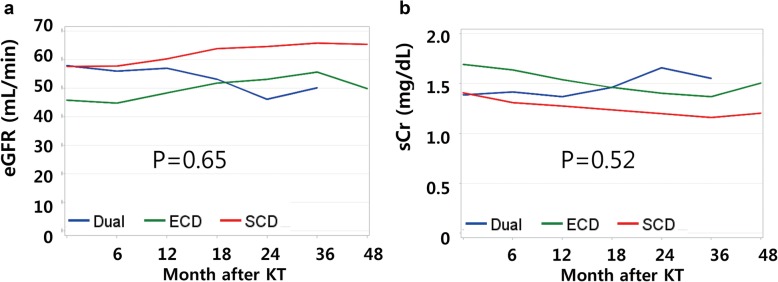
Fig. 2.
Graft function after kidney transplantation. a Post-transplant eGFR at one year after KT was lowest in ECD group. At two and three years after KT, eGFRs were lowest in DKT group. b Opposite pattern was seen in sCr level. However, the trend of changing eGFR and sCr level were not significantly different according to each groups

