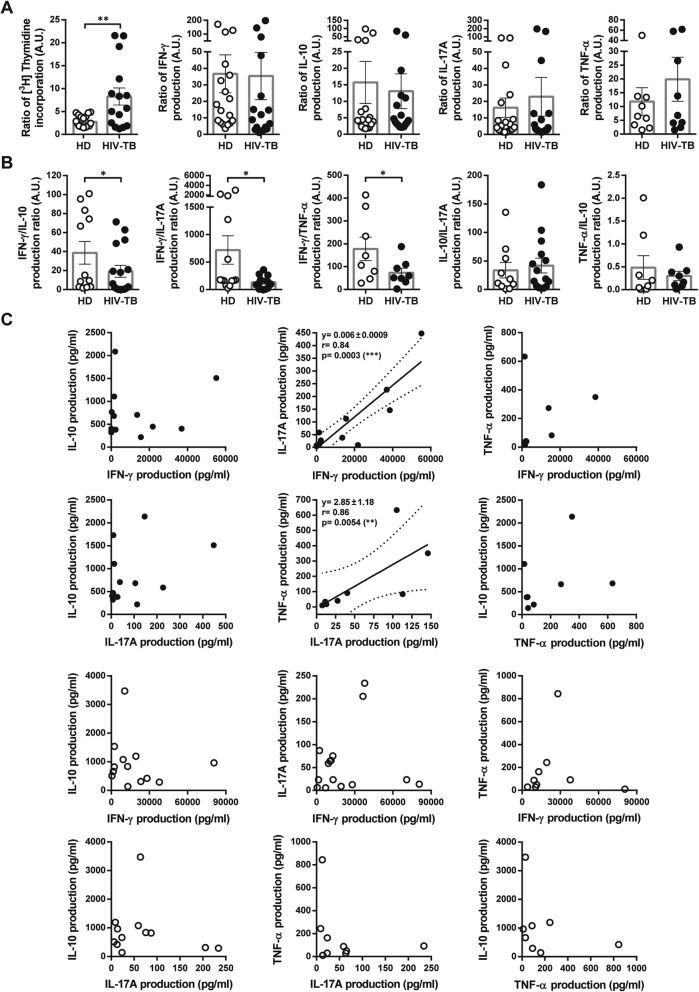
Fig. 1.
In vitro responses to M. tuberculosis of PBMCs from HIV-TB and HD individuals. PBMCs from HD and HIV-TB individuals were stimulated with gamma-irradiated Mtb (10 μg/ml) for 5 days. Each graph depicts values from HIV-TB patients (black circles) and HD (open circles). Each symbol represents an individual subject. a Mtb-induced proliferation and cytokine secretion. The Y axis shows cell proliferation or cytokine production. Values are relativized to unstimulated cells. b Cytokine production profiles from HD and HIV-TB in response to Mtb. The Y axis indicates cytokine ratio. Error bars show mean ± SEM. Unpaired t test or Mann-Whitney U test, as appropriated *p < 0.05, **p < 0.01. c Correlation analysis among secretion of IFN-γ, IL-10, IL-17A and TNF-α from HIV-TB and HD groups. Continuous lines represent linear regression curves, and dashed lines represent 95% confidence intervals. Spearman’s rank correlation coefficient (r), p value and slope are indicated

