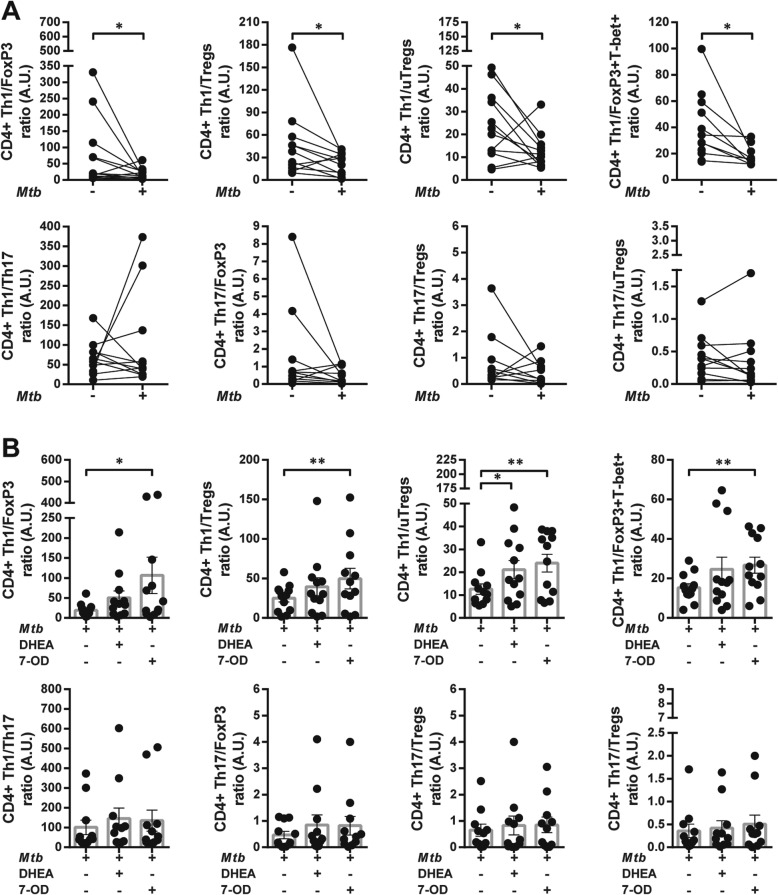
Fig. 12.
The equilibrium between Th1, Tregs, uTregs and Th17 subsets are disrupted by Mtb and modified by 7-OD and DHEA. Recently thawed or freshly isolated PBMCs from HIV-TB individuals were stained and analyzed by flow cytometry, as indicated in methods. Figure shows CD4 + T cell subset ratios. The results are plotted for HIV-TB patients (black circles) comparing (a) Control vs. stimulated cells. Unpaired t test or Mann-Whitney U test, as appropriated *p < 0.05. (b) Distinct CD4+ Th subset ratios of Mtb-stimulated PBMCs treated with 7-OD and DHEA. Each symbol represents an individual subject. Friedman test followed by post-hoc comparisons: Fisher’s LSD or Dunn’s test, as appropriated *p < 0.05, **p < 0.01 and ***p < 0.005

