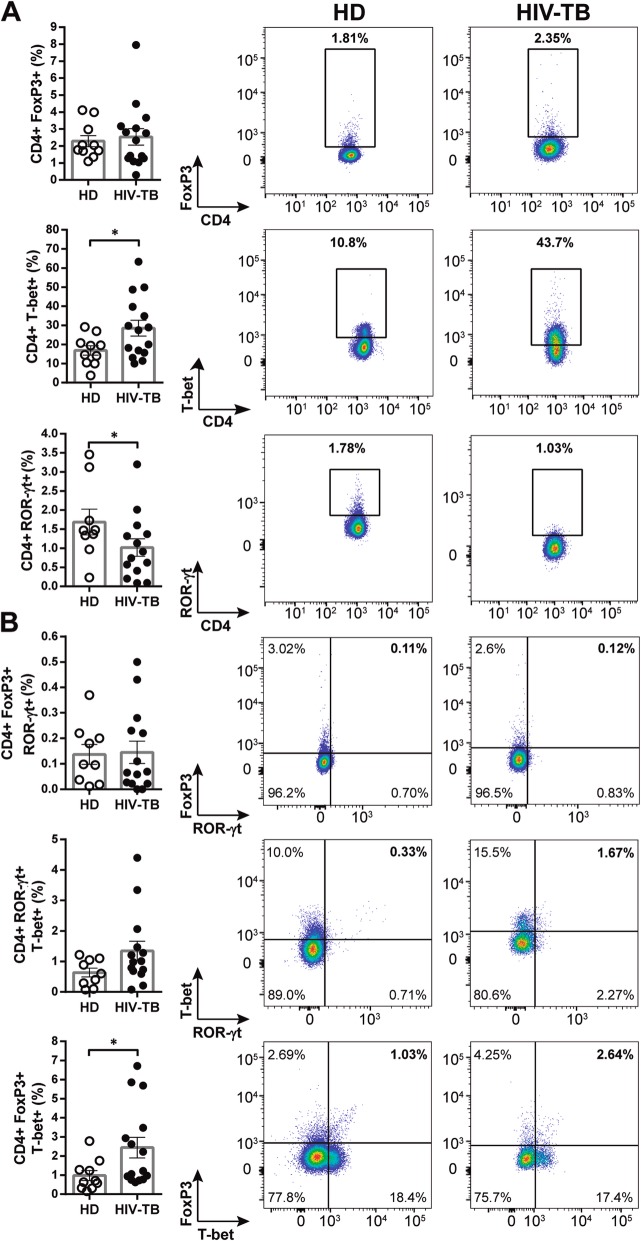
Fig. 4.
Phenotype of CD4 + T cells from HD and HIV-TB. Recently thawed or freshly isolated PBMCs were stained and analyzed by flow cytometry. Figure shows the percentage of CD4+ cells that express (a) FoxP3, T-bet or ROR-γt and (b) the co-expression of transcription factors using a Boolean gating strategy. Representative flow cytometry examples are shown. The results are plotted for HD (open circles) and HIV-TB patients (black circles). Each symbol represents an individual subject. Unpaired t test or Mann-Whitney U test, as appropriated *p < 0.05

