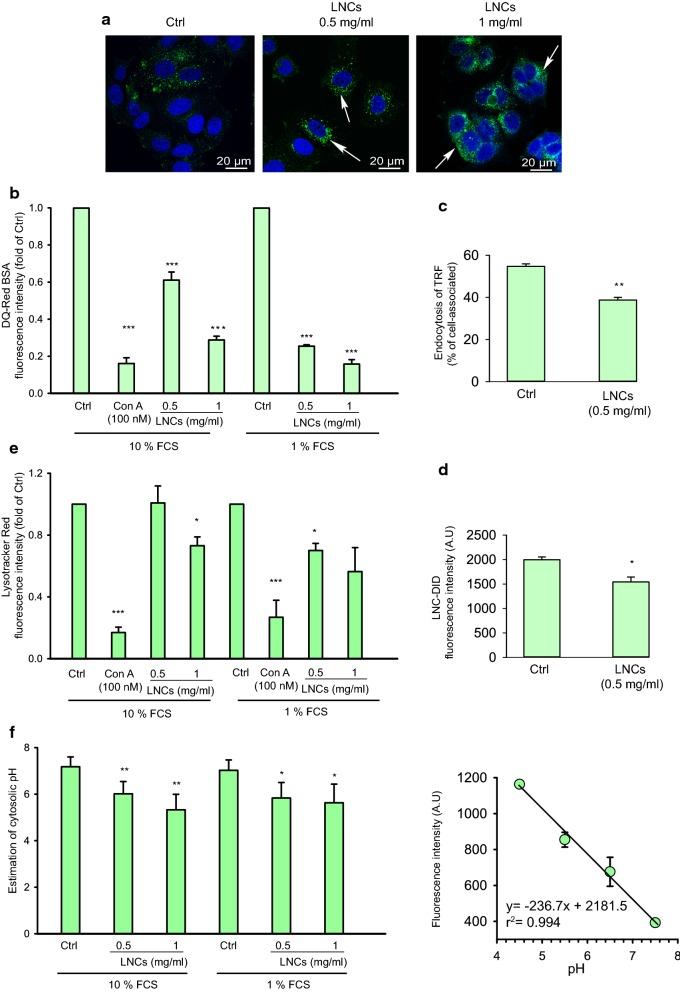
Fig. 8.
Effect of LNCs on endocytosis and intracellular transport. Details as described in Materials and Methods. a Representative fluorescence micrographs of MCF-7 cells treated with 0, 0.5 and 1 mg/ml LNCs in full growth culture medium for 4 h at 37 °C before fixation. The cell nucleus was stained with Hoechst (blue) and lysosomes were stained with anti‐LAMP1 (green). The arrows indicate apparently larger and/or aggregated lysosomes. The scale bar represents 20 μm. b Measurements of DQ-Red BSA fluorescence after 2 h incubation at 37 °C of MCF-7 cells with 0.5 and 1.0 mg/ml of LNCs; the v-ATPase inhibitor Concanamycin A (100 nM) was added at the same time as the LNCs. The experiments were performed in cell growth medium supplemented with 10% or 1% FCS. The median fluorescence intensity of DQ-Red BSA was measured by flow cytometry. c Endocytosis of 125I-labeled transferrin in MCF-7 cells incubated with and without 0.5 mg/ml LNCs for 2 h at 37 °C. The error bars show mean ± SEM from three independent experiments.*p < 0.05. d Uptake of LNCs stained with DID after incubation as in c. The results are shown as the fluorescence intensity measured in 10,000 viable cells by flow cytometry. *p < 0.05. e The staining of lysosomes of MCF-7 cells by Lysotracker Red® after 2 h incubation at 37 °C with LNCs (0.5 and 1 mg/ml) in medium supplemented with 1% and 10% FCS as described in methods. The fluorescence intensity of Lysotracker Red® was detected by flow cytometry (10,000 cells were collected). f Cytosolic pH was estimated after 2 h incubation in the absence and presence of LNCs as described in “Materials and methods”. The resulting cytosolic pH is shown to the left, and the standard curve to the right. Error bars for the cytosolic pH show mean ± SEM; n = 6. Error bars for the standard curve show mean ± SD; n = 2

