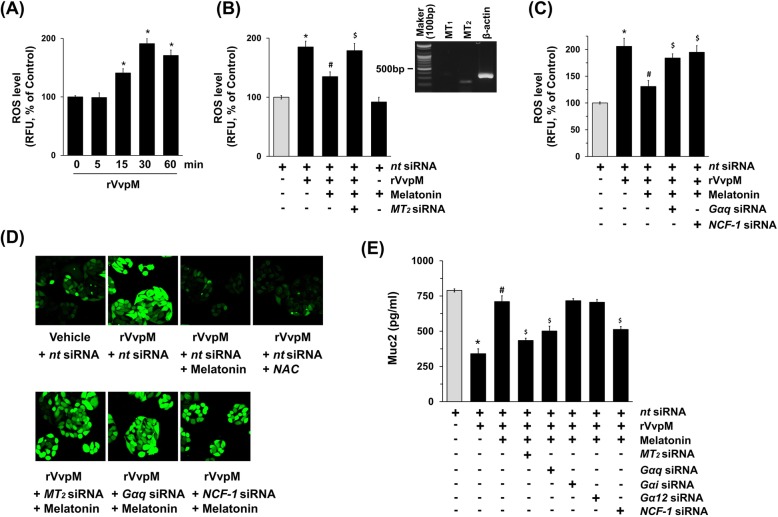
Fig. 2.
Melatonin triggers the MT2 receptor-mediated signaling pathway to regulate ROS production induced by rVvpM. a Time responses of rVvpM in ROS production are shown. Data represent means ± S.E. n = 4. *, p < 0.01 vs. 0 min. RFU, relative fluorescence units. b Cells transfected with siRNA for non-targeting (nt) control or MT2 for 24 h were incubated with melatonin (1 μM) for 30 min prior to rVvpM exposure for 30 min. The level of ROS production is shown. Inset shows the expression of MT1 and MT2 on total RNA of HT29-MTX cells. Data represent means ± S.E. n = 4. *, p < 0.001 vs. nt siRNA. #, p < 0.01 vs. rVvpM + nt siRNA. $, p < 0.01 vs. rVvpM + melatonin+ nt siRNA. c Cells transfected with siRNA for Gαq or NCF-1 for 24 h were incubated with melatonin (1 μM) for 30 min prior to rVvpM exposure for 30 min. The level of ROS production is shown. Data represent means ± S.E. n = 4. *, p < 0.01 vs. nt siRNA. #, p < 0.01 vs. rVvpM + nt siRNA. $, p < 0.05 vs. rVvpM + melatonin+ nt siRNA. d Cells transfected with siRNA for MT2, Gαq, or NCF-1 for 24 h were incubated with melatonin (1 μM) or NAC (10 μM) for 30 min prior to rVvpM exposure for 30 min. ROS production (green) was visualized by confocal microscopy. Scale bars, 100 μm. n = 3. e Cells transfected with siRNA for MT2, Gαq, Gαi, Gα12 or NCF-1 for 24 h were incubated with melatonin (1 μM) for 30 min prior to rVvpM exposure for 24 h. The level of Muc2 production was quantified by ELISA. Data represent means ± S.E. n = 4. *, p < 0.01 vs. nt siRNA. #, p < 0.05 vs. rVvpM + nt siRNA. $, p < 0.05 vs. rVvpM + melatonin+ nt siRNA

