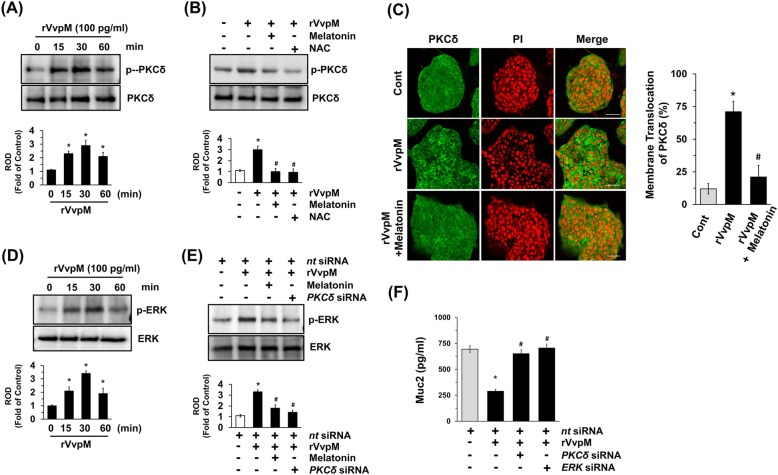
Fig. 3.
Melatonin inhibits PKCδ/ERK pathway activated by rVvpM. a Time responses of rVvpM in phosphorylation of PKCδ are shown. Data represent means ± S.E. n = 4. *, p < 0.001 vs. 0 min. ROD, relative optical density. b Phosphorylation of PKCδ in cells treated with melatonin (1 μM) or with NAC (10 μM) for 30 min prior to rVvpM exposure for 30 min is shown. Data represent means ± S.E. n = 4. *, p < 0.01 vs. vehicle. #, p < 0.01 vs. rVvpM alone. c Membrane translocation of PKCδ (green) was determined by confocal microscopy. Propidium iodide (PI) was used for nuclear counterstaining (red) (right panel). The cell numbers showing membrane translocalization of PKCα per microscopic filed were directly counted and converted to a percentage by multiplying by 100. Ten random fields per coverslip were counted (left panel). Data represent the mean ± S.E. Scale bars, 100 μm. n = 3. d Time responses of rVvpM in phosphorylation of ERK are shown. Data represent means ± S.E. n = 4. *, p < 0.05 vs. 0 min. e Phosphorylation of ERK in cells treated with melatonin (1 μM) for 30 min prior to rVvpM exposure for 30 min is shown. Cells transfected with PKCδ siRNA for 24 h were also incubated with rVvpM for 30 min. Data represent means ± S.E. n = 4. *, p < 0.05 vs. nt siRNA. #, p < 0.01 vs. rVvpM + nt siRNA. f Cells transfected with siRNA for PKCδ or ERK1/2 for 24 h were incubated with rVvpM for 24 h. The level of Muc2 production was quantified by ELISA. Data represent means ± S.E. n = 4. *, p < 0.01 vs. nt siRNA. #, p < 0.01 vs. rVvpM + nt siRNA

