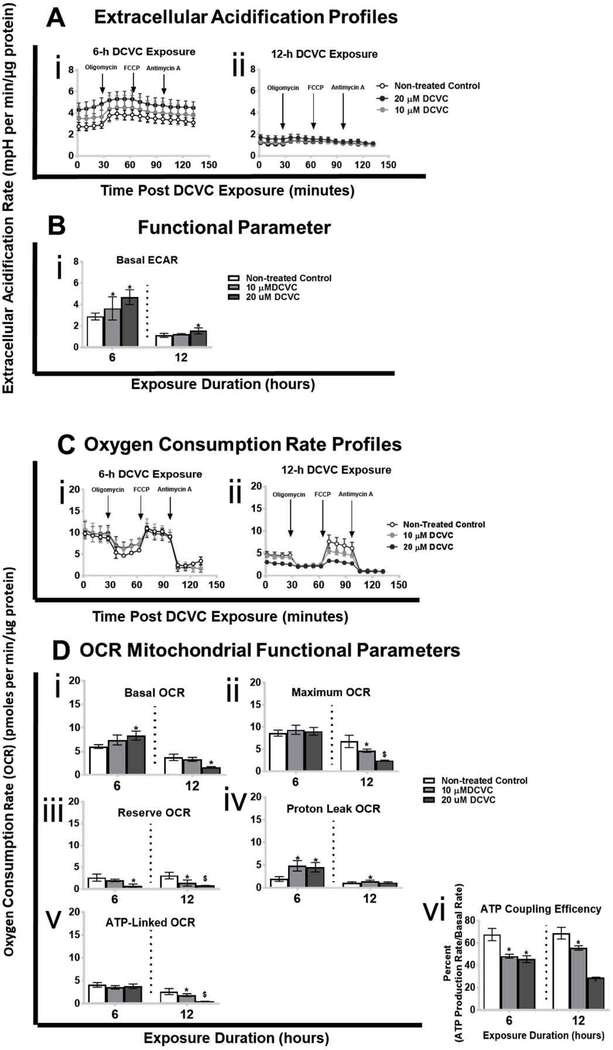
Figure 1. Effects of DCVC on extracellular acidification rate (ECAR), oxygen consumption rate (OCR) and mitochondrial functional parameters.
Cells were treated for 6 or 12 h with medium alone (control), or with 10 or 20 μM DCVC. Following exposure, ECAR and OCR were measured simultaneously in real-time using the Seahorse XF24e or XF24 analyzers. Key mitochondrial functional parameters were assessed by serially injecting compounds that target specific portions of the electron transport chain (oligomycin, FCCP, antimycin A/rotenone) into wells with the cells. Mitochondrial functional parameters were measured or calculated as described in the methods section. A) Extracellular acidification rate ECAR profiles following DCVC treatment for (i) 6 h and (ii) 12 h. Data points represent mean ECAR ± SEM at 5-minute intervals. B) ECAR functional parameter: basal ECAR. C) Oxygen consumption rate profiles following DCVC treatment for (i) 6 h and (ii) 12 h. Data are graphed as mean OCRs ± SEM at 5-minute intervals. Arrows indicate times when electron transport chain modifiers were injected into sample wells. D) OCR functional parameters: (i) basal OCR, (ii) maximum OCR, (iii) reserve OCR, (iv) proton leak OCR, (v) ATP-linked OCR, and (vi) ATP coupling efficiency. Bars represent means ± SEM. Data were analyzed by adjusted linear mixed-models with posthoc Tukey multiple comparisons restricted to comparison within each time point because experiments were conducted separately (as indicated by vertical dashed line on graph). Asterisk indicates significant difference compared to controls within same time point: *P<0.05. Dollar sign indicates significant difference compared to controls and 10 μM DCVC within same time point: $P<0.05. N= 3 independent experiments for each time point.

