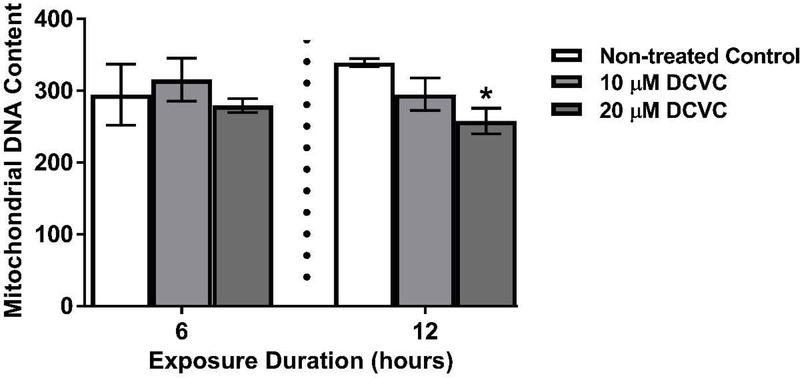
Figure 2. Effects of DCVC mitochondrial DNA content.
Cells were treated for 6 or 12 h with medium alone (control), or with 10 or 20 μM DCVC. Mitochondrial DNA content, a proxy for mitochondrial copy number, was estimated by measuring genomic DNA of two mitochondrial genes and two nuclear genes, and calculating the ratios: ND1/SLCO2B1 and ND5/SERPINA1. Bars represent means ± SEM. Data were analyzed by one-way ANOVA with posthoc Tukey’s multiple comparisons within each time point because experiments were conducted separately (as indicated by vertical dashed line on graph). Asterisk indicates significant difference compared to control within the same time point: *P =0.0192. N=3 independent experiments for the 6-h time point and N=4 independent experiments for the 12-h time point.

