Figure 4.

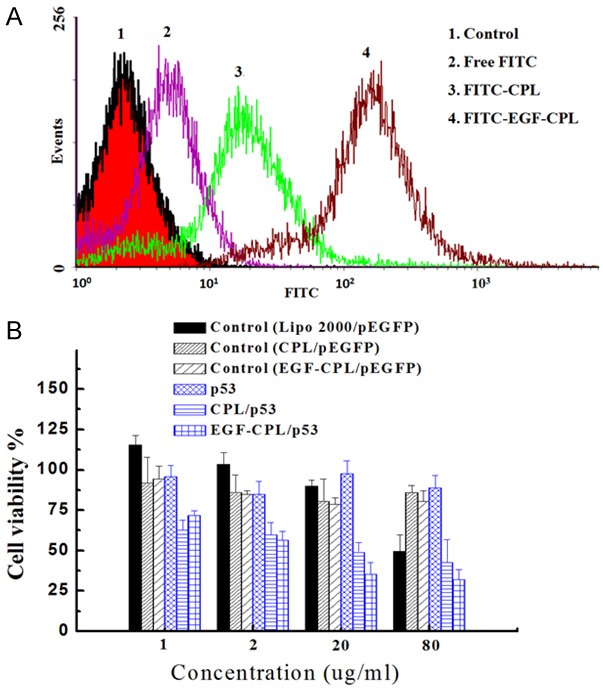
A. Flow cytometry analysis of SKOV3 cells incubated with the control, free FITC, FITC-CPL and FITC-EGF-CPL for 20 min at the same NP concentrations (20 μg/mL). B. The cytotoxicity of CPL and EGF-CPL were measured using MTT assays after a 48-h incubation with SKOV3 cells, enhancing the inhibition effect on cell growth with CPL/P53 and EGF-CPL/P53 complexes in the SKOV3 cells. Each point represents the mean ± SD of three experiments.
