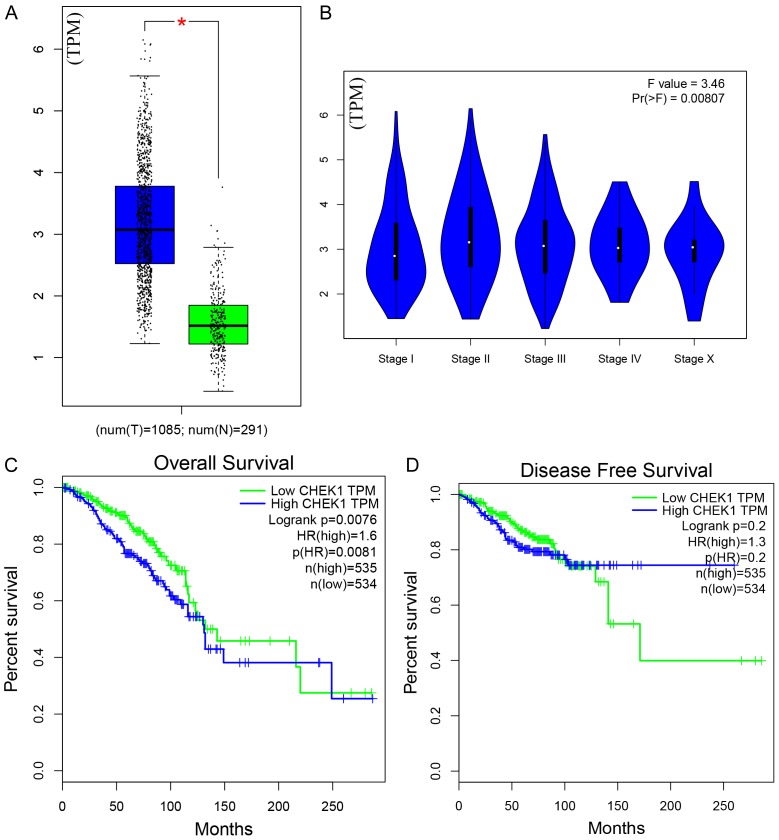
Figure 2.
The mRNA expression levels and survival courses of CHEK1 in both BC and non-BC tissues, based on TCGA. A. The mRNA expression levels in BC and non-BC tissues; the blue represents the mRNA level of CHEK1 in tumor tissues, and the green represents the level in normal tissues; the black dot represents each individual expression level. B. The mRNA expression levels in different clinical stages. C. The overall survival curve of CHEK1. D. The disease-free survival curve of CHEK1; the blue line represents high CHEK1 expression, and the green line represents low CHEK1 expression.

