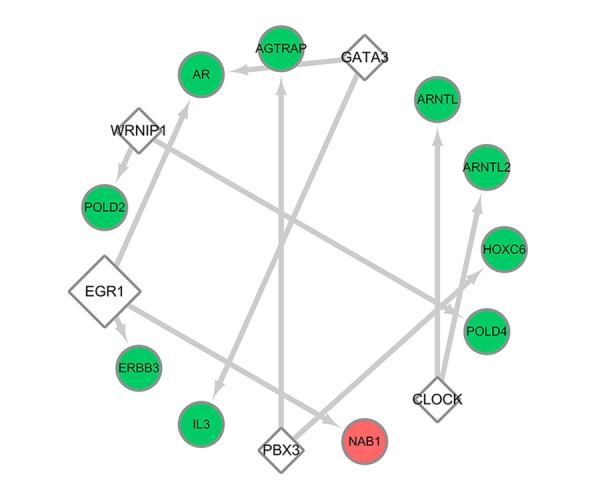
Figure 10.

Regulatory network of transcription factors and target genes in the present study. The bigger rhombuses represent transcription factors that possess more targets. The green and red circles represent the downregulated and upregulated genes, respectively, identified in the study.
