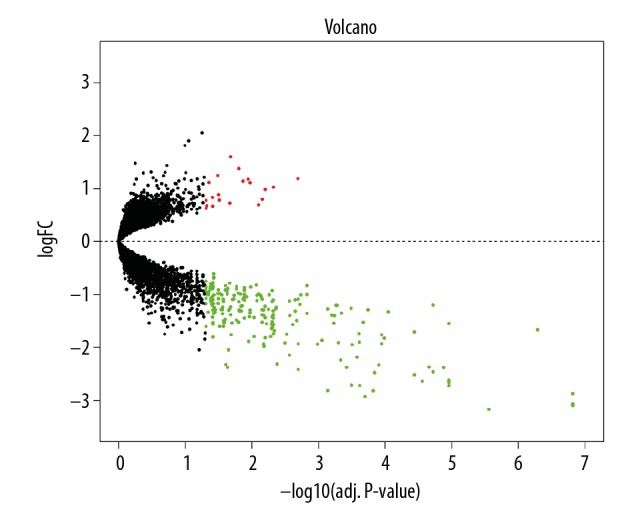
Figure 2.

Differential expression of data between atherosclerotic and nonatherosclerotic macrophage samples. Black plots represent down- and upregulated genes, and red or green dots were significant differentially expressed genes. LogFC – log2-fold change.
