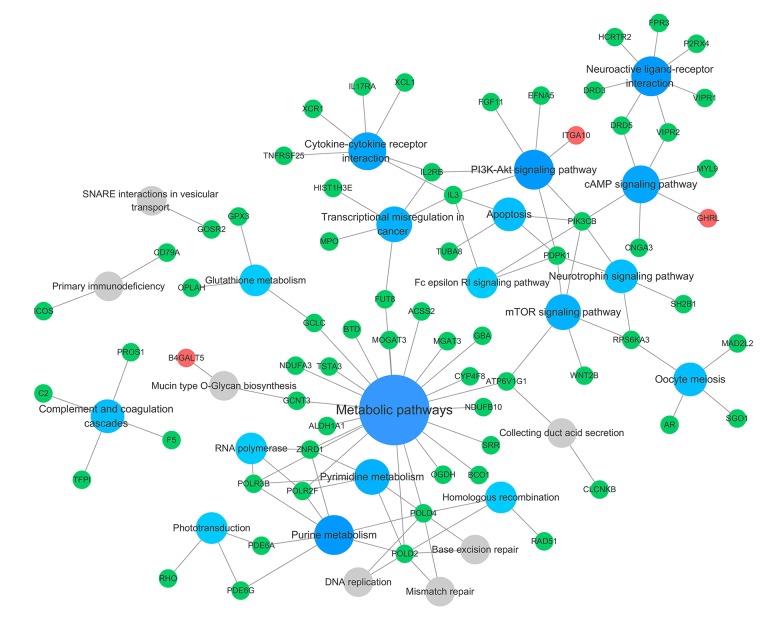
Figure 6.
Significant KEGG pathway enrichment of identified DEGs. The big blue circles represent signaling pathways that contain more input genes, and the small grey circles represent signaling pathways that contain fewer input genes. The green and red circles represent the downregulated and upregulated genes, respectively, identified in the study.

