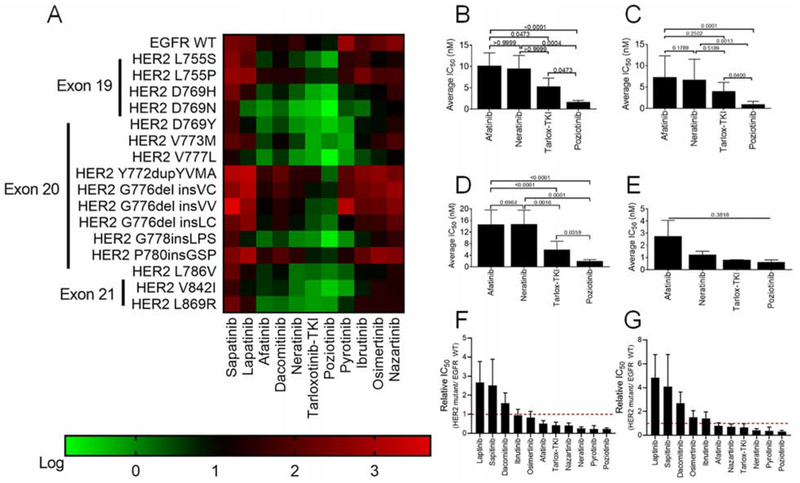
Figure 4:
Potency of TKIs in Ba/F3 cell lines expressing HER2 mutants. (A) Heatmap of log IC50 values calculated in GraphPad for Ba/F3 cells stably expressing the indicated mutants and after 72 hr of drug treatment, (n ≥ 3). (B-E) Average IC50 values for Ba/F3 cell lines expressing all HER2 mutants (B), HER2 exon 19 mutants (C), HER2 exon 20 mutants (D), or HER2 exon 21 mutants (E) after treatment for 72 hr with indicated TKIs. (F and G) Bar plots of ratio of IC50 values of all HER2 mutant (F) or HER2 exon 20 mutant (G) to WT EGFR in the presence of 10 ng/ml EGF. (B-G) Bars are representative of mean ± SEM (n ≥ 3). See also Figure S3.

