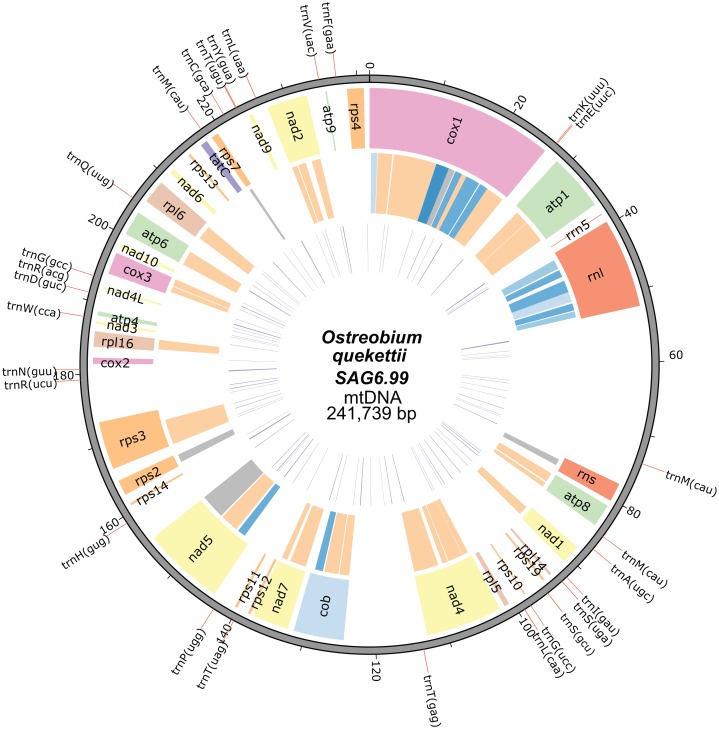
Figure 1. Mitochondrial genome map of Ostreobium quekettii SAG6.99.
The position of tRNAs are shown on the outer track (red lines). The first inner circle represents the position, size and the names of the protein-coding and rRNA genes. The introns are shown in the second inner circle and are colour coded according to intron types/subtypes: group I derived (very light blue), group IA (light blue), group IB (blue), group ID (dark blue), group II (orange), unknown (grey). The third inner circle represents the position and length (line thickness) of repeats.

