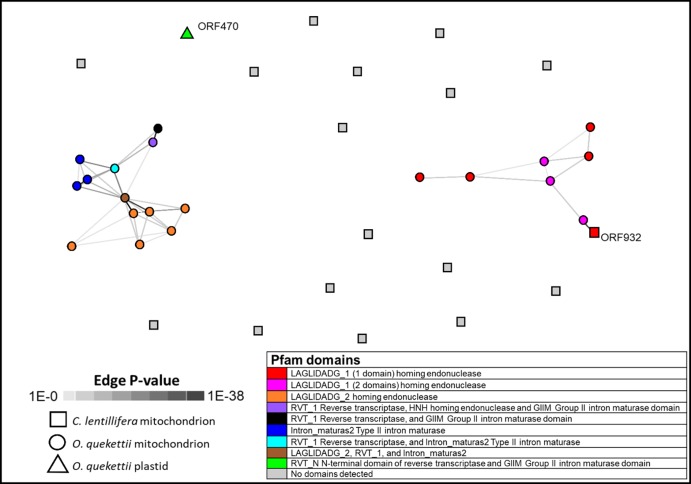
Figure 2. Similarity network generated from all against all BLAST+ similarities of ORFs encoded in the Caulerpa lentillifera mitochondrion, and Ostreobium quekettii mitochondrion and chloroplast.
Each node represents an ORF, and each edge (line) represents a significant HSP (high scoring segment pair), shaded according to p value. Generated using CLANS through the MPI Bioinformatics Toolkit (Scoring Matrix BLOSSUM62, extracting BLAST HSPs up to e-values of 1e−4, using p-values better than 1.0).

