Figure 3.

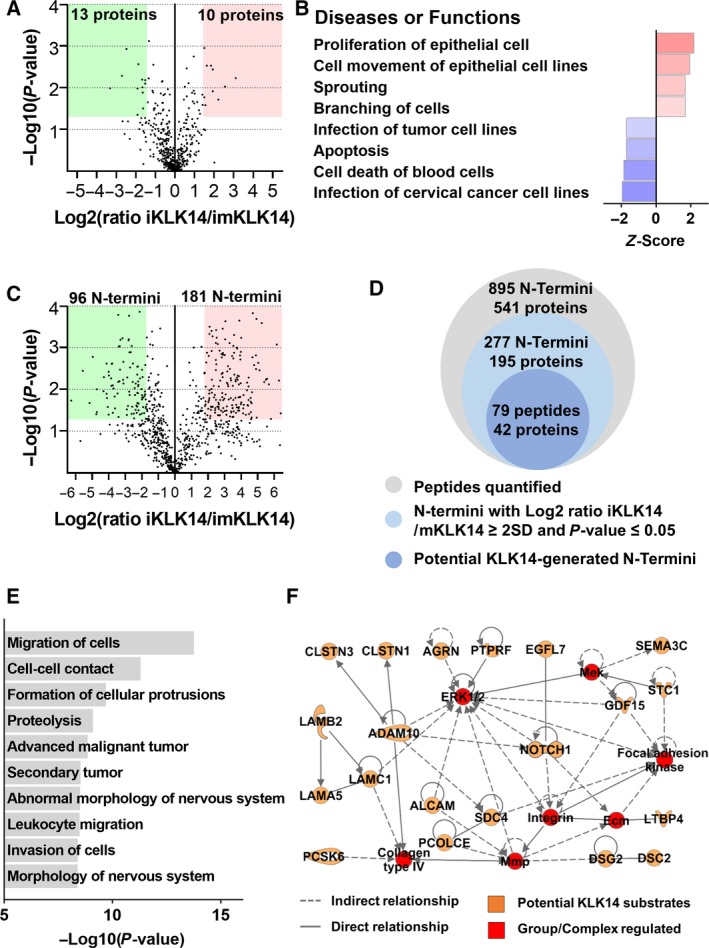
Identification of KLK14‐regulated proteins in secretome of LNCaP cells. (A) Volcano plot of P‐value [−Log10(P‐value)] as a function of FC [log2(ratio iKLK14/imKLK14)] for proteins identified in Pre‐TAILS analysis. The number of proteins with significant quantitative difference is indicated. (B) Diseases or functions predicted to be significantly activated or inhibited in IPA performed on proteins modulated after KLK14 induction in LNCaP cells. (C) Volcano plot of P‐value [−Log10(P‐value)] in function of FC [log2(ratio iKLK14/imKLK14)] for N termini identified in Pre‐TAILS and TAILS analysis. The number of peptides with significant quantitative difference is indicated. (D) Number of N termini quantified, significantly dysregulated, and corresponding to putative KLK14 substrates in Pre‐TAILS and TAILS analysis. (E) Diseases or functions found significantly enriched in IPA analysis performed on putative KLK14 substrates. (F) Interaction network identified by IPA composed of 20 out of 43 KLK14 substrates (indicated in orange in network).
