
Figure 4.
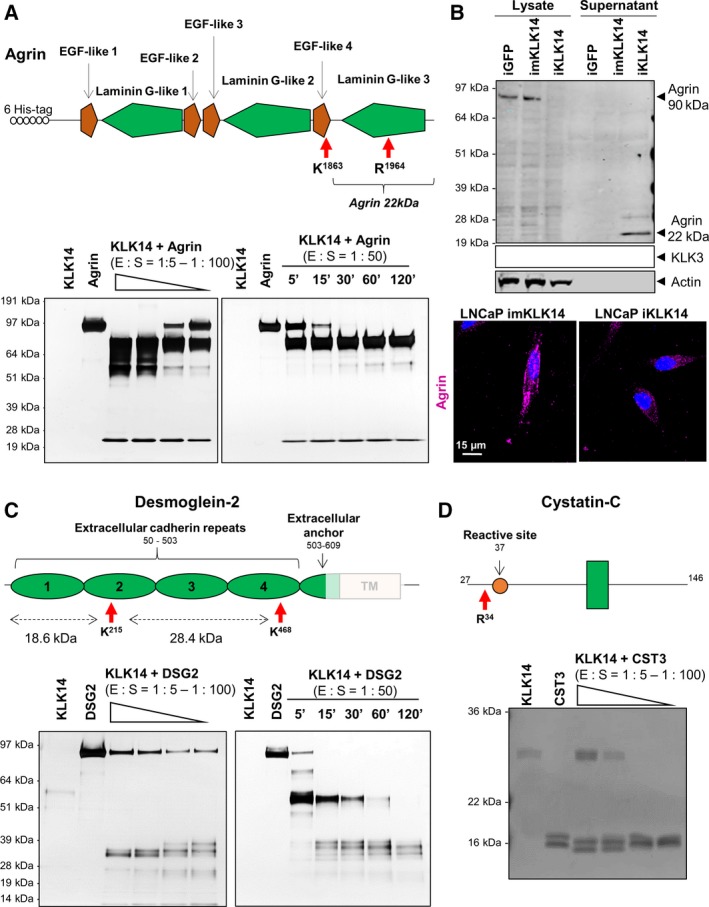
Validation of KLK14 newly identified substrates. (A) Top: Schematic of recombinant AGRN used with different protein domains and KLK14‐cleavage sites indicated. Bottom: Silver‐stained SDS/PAGE gels corresponding to the dose–response (left) and kinetics of recombinant AGRN proteolysis (right) by recombinant active KLK14. (B) Top: Western blot indicating the decrease of 90kDa AGRN in cell lysate and the release of 22kDa AGRN in the CM of iKLK14‐LNCaP cells. Bottom: Immunofluorescence microscopy imaging of imKLK14‐ and iKLK14‐LNCaP cells stained for AGRN (pink) and nucleus (DAPI, blue). Scale bar: 15 µm. (C) Top: Schematic of recombinant DSG2 used with its different protein domains and KLK14‐cleavage sites indicated. Bottom: Silver‐stained SDS/PAGE gels corresponding to the dose–response (left) and kinetics (right) of recombinant DSG2 proteolysis by recombinant active KLK14. (D) Top: Schematic of recombinant CST3 used with its different protein domains and KLK14‐cleavage sites indicated. Bottom: Silver‐stained SDS/PAGE gel corresponding to the dose–response of recombinant CST3 proteolysis by recombinant active KLK14. Dose–response proteolysis experiments have been performed at molar ratio of enzyme/substrates ranging from 1 : 5 to 1 : 100 for 2 h at 37 °C. Kinetic proteolysis experiments have been performed at a molar ratio of enzyme/substrate of 1 : 50 for 5, 15, 30, 60, and 120 min at 37 °C. EGF: epidermal growth factor; E:S: enzyme:substrate ratio.