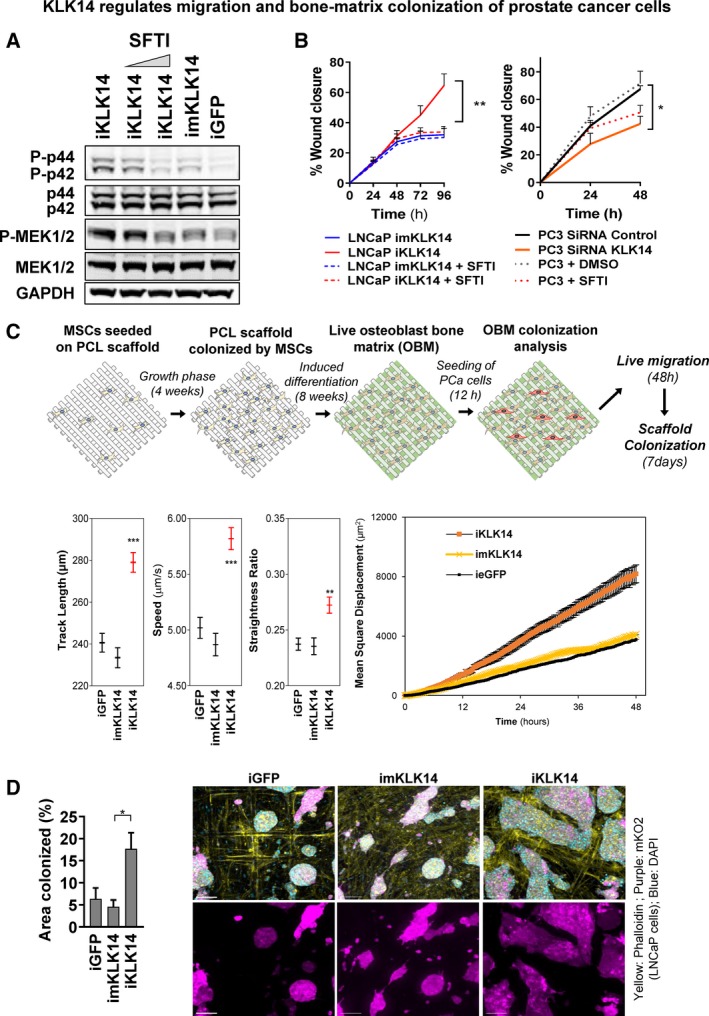
Figure 6.

KLK14 regulates MAPK activation, migration and bone‐matrix colonization of PCa cells. (A) Analysis of phosphorylation states of MAPK pathway proteins (p42/44 and Mek1/2) in iGFP‐, imKLK14‐, and iKLK14‐LNCaP cells grown in RPMI‐1% FBS for 3 days in the presence of doxycycline ± 1 or 2.5 µm SFTI‐WCIR. N = 3; representative blot shown. (B) Scratch wound migration assay performed with imKLK14‐ and iKLK14‐LNCaP cells in same conditions as that in A (left) and with PC‐3 cells transfected with siRNA nontargeting and siRNA KLK14 in RPMI‐1% FBS ± 2.5 µm SFTI‐WCIR (right). Results are presented as mean ± SD. N = 3, *P < 0.05, **P < 0.01, Two‐way ANOVA test. (C) Top: Schematic picturing the workflow of production of human OBM and migration/colonization assays. Bottom: Results from live cell migration analysis of iGFP‐, imKLK14‐ and iKLK14‐LNCaP cells onto OBM in RPMI + 1%FBS containing doxycycline with measured average track length (µm), speed (µm·s−1), straightness ratio, and MSD (µm2). Measurements performed on an average of 315 cells per condition (N = 2 independent biological replicates with two different OBM preparations). Results are presented as mean ± SEM. (D) Measurement of OBM scaffold colonization by iGFP‐, imKLK14‐, and iKLK14‐LNCaP cells 7 days after seeding. Left: Graphic representing the OBM scaffold area occupied by LNCaP cells (% of whole scaffold surface, mean ± SD). Right: Representative images of iGFP‐, imKLK14‐ and iKLK14‐LNCaP cells on OBM scaffold after 7 days of culture in RPMI‐1% FBS containing doxycycline (N = 4 scaffolds per condition). Scale bar: 500 µm.
