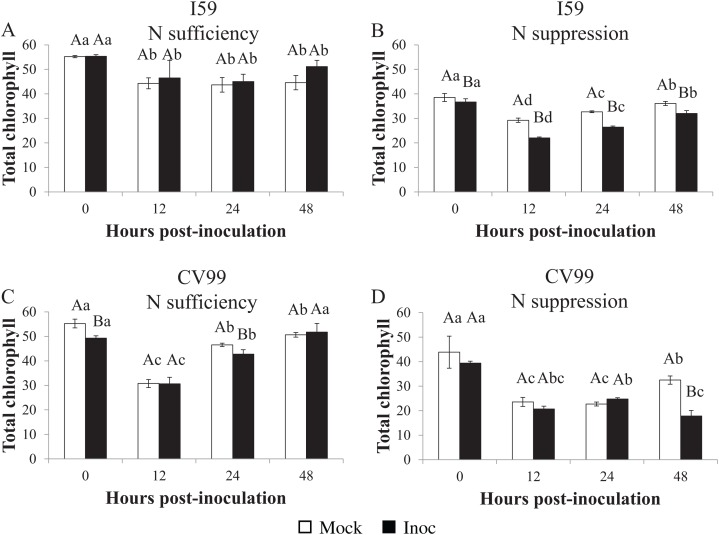
Figure 5. Concentration of total chlorophyl in resistant (I59) (A and B) and susceptible (CV99) (C and D) coffee genotypes under N sufficiency (A and C) and N suppression (B and D) conditions with mock and rust inoculated coffee leaves.
The vertical bars indicate the values presented by the mean ± standard error (n = 3) of NR in vitro activity for each hour post-inoculation (HPI) and genotype. Averages followed by the same capital letter, compare differences between mock and rust inoculated coffee leaves at the same HPI, did not differ significantly by the Tukey test (p < 0.05). Averages followed by the same lowercase letter, compare differences between the treatments (mock and inoc) at different HPI, did not differ significantly by the Tukey test (p < 0.05).

