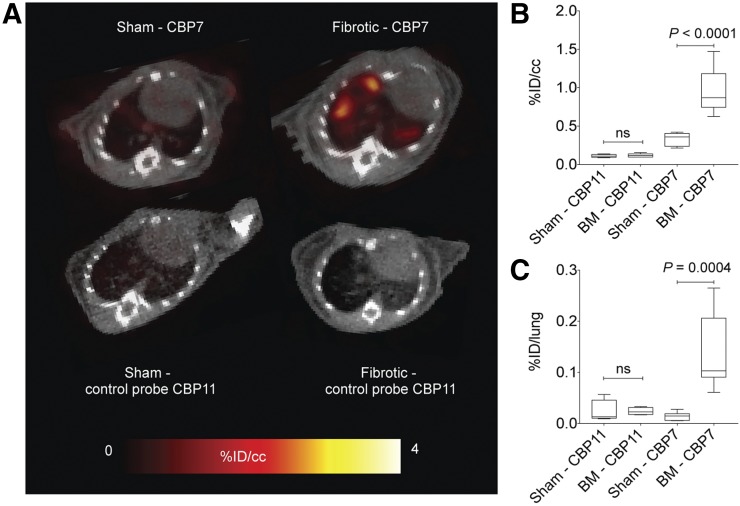
FIGURE 4.
(A) Representative fused PET/CT images (axial view) of sham and bleomycin-treated animals injected with CBP7 (top) and CBP11 (bottom). Color scale image shows PET image from integrated data 100–120 min after probe injection. (B) Mean lung PET activity values (%ID/cm3) in sham and bleomycin-treated mice for CBP7 and CBP11 from data 100 to 120 min after injection. (C) Ex vivo lung uptake in sham and bleomycin-treated mice at 150 min after CBP7 and CBP11 injection. BM = bleomycin.

