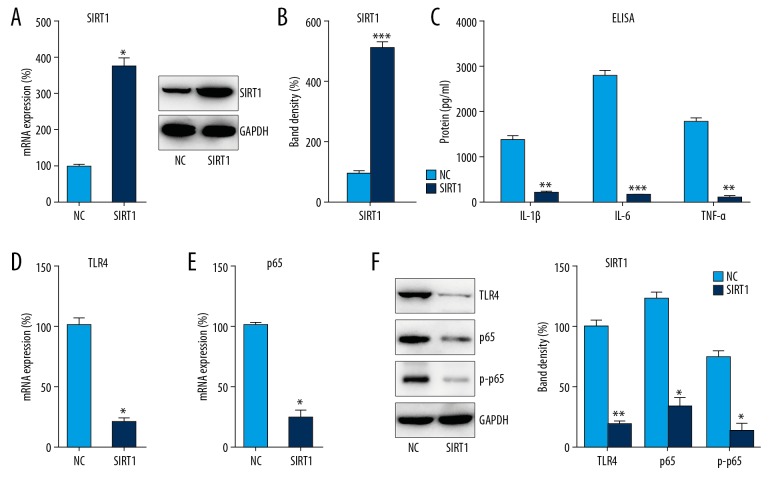
Figure 6.
SIRT1 overexpression repressed LPS-induced inflammation in DPSCs. DPSCs were transfected with pcDNA3-SIRT1 or NC plasmid for 24 h followed by LPS treatment for 8 h. (A) Q-PCR and (B) WB analyses were used to examine SIRT1 levels in cell lysates. (C) ELISA was conducted to assess IL-1β, IL-6, and TNF-α expression. (D, E) Cell lysates were subjected to Q-PCR to assess TLR4 and NFκB p65 expression. (F) WB analysis was performed to probe with antibodies for phosphorylated p65, total p65, and TLR4 in cell lysates. Data are represented as means±SD. * P<0.05; ** P<0.01; *** P<0.001.

