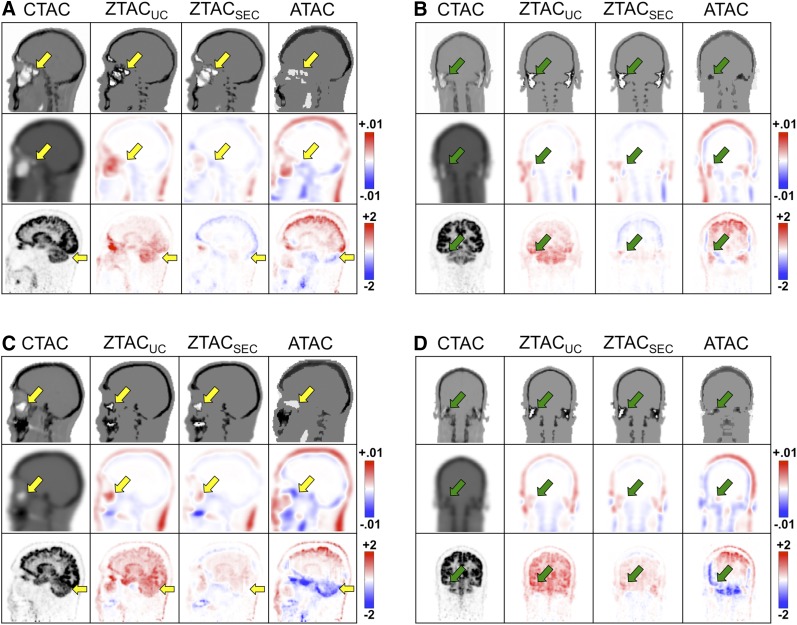
FIGURE 6.
Patients 5 (A and B) and 8 (C and D) in coronal and sagittal views for CT and pseudo-CTs (first row), attenuation-correction (AC) maps (second row), and corresponding PET images (third row) according to AC methods. Second and third rows illustrate difference images on second through fourth columns for pseudo-CT–derived AC maps from CT-derived AC maps (unit, cm−1) and PET/MRAC from PET/CTAC (unit, SUV), respectively. Arrows indicate sinus, mastoid, and cerebellum.

