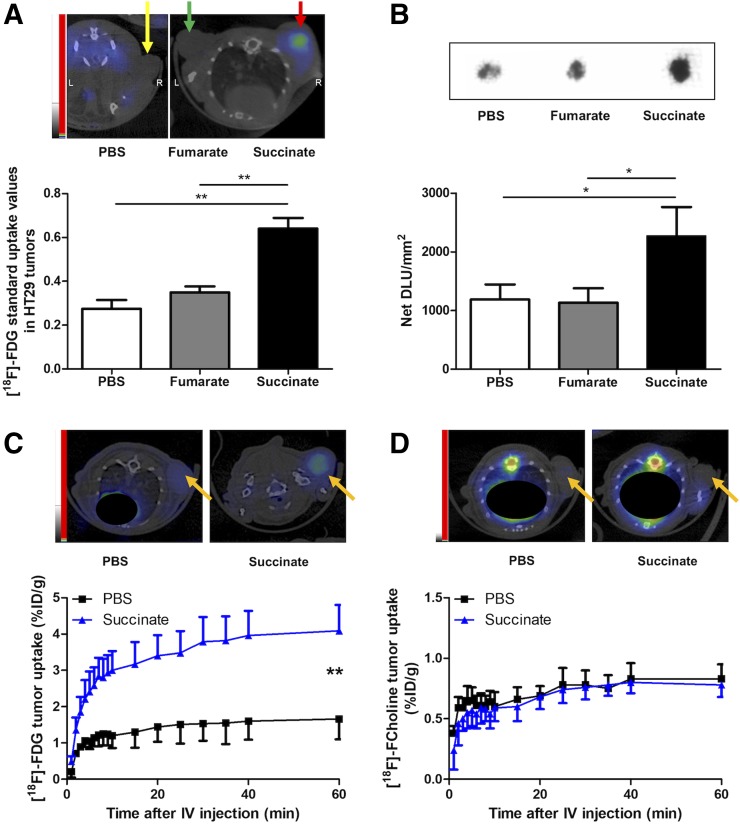
FIGURE 1.
(A) Representative PET/CT images of HT-29 tumor–bearing mice (n = 3) 40 min after 18F-FDG injection (5–10 MBq/50 μL, intraperitoneally) and 27 h after the first 10-μL intratumoral injection of 1 mM succinate (right shoulder, red arrow), 1 mM fumarate (left shoulder, green arrow), or PBS (right hind limb, yellow arrow) every 6 h for 24 h, along with graph showing quantifications from 18F-FDG small-animal PET/CT in tumors. **P < 0.01, 1-way ANOVA with Bonferroni post hoc test, 3 mice per condition. (B) Representative autoradiographic images of HT-29 tumors extracted from mice immediately after small-animal PET/CT imaging, along with graph showing quantifications from tumor autoradiography. *P < 0.05, 1-way ANOVA with Bonferroni post hoc test, 3 mice per condition. (C) Representative small-animal PET/CT images of mouse hind limbs 40 min after 18F-FDG injection (5–10 MBq/50 μL, intravenously) and 27 h after first succinate or PBS injection every 6 h for 24 h, along with graph showing quantifications expressed as percentage injected dose per gram of tissue (%ID/g) over time from dynamic small-animal PET/CT reconstruction. **P < 0.01, Mann–Whitney test, 3 mice per condition. (D) Representative small-animal PET/CT images 40 min after 18F-fluorocholine injection (5–7 MBq/50 μL, intravenously) and 27 h after first succinate or PBS injection every 6 h for 24 h, along with graph showing quantifications expressed as %ID/g over time from dynamic small-animal PET/CT reconstruction. P = 0.609, Mann–Whitney test, 3 mice per condition. DLU = digital light units.

