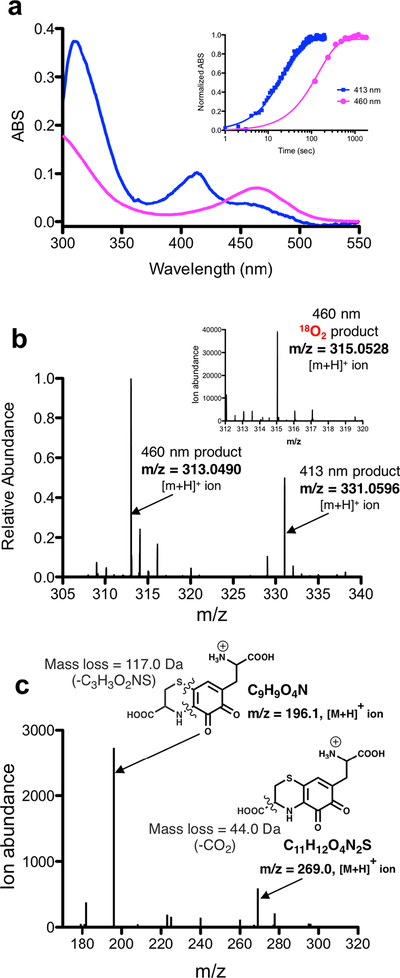
Figure 6. Characterization of down-pathway reactions.
a) Overlaid UV-Visible spectra of the proposed isoquinoloid (magenta) product that appears after formation of OH-Cys-DOPA quinone (blue). Inset shows a time-course comparing the appearance of the initial 413 nm absorbance band (OH-Cys-DOPA quinone) and the subsequent 460 nm absorbance band (assigned to the putative isoquinoloid). b) A HRMS spectrum of a reaction of PqqB with Cys-DOPA at 1hr shows two predominant products occurring at m/z = 313.0490 ([M+H]+) (isoquinoloid) and m/z = 331.0596 ([M+H]+) (OH-Cys-DOPA quinone). Relative product distribution has been calculated from integrated extracted ion chromatographs (Table S3). Inset is a mass spectrum that shows isotope 18O-incorporation when reactions were conducted under an 18O2 atmosphere. c) MS/MS analysis of the product where the ion occurring at m/z = 313.0490 ([M+H]+) has been fragmented by collision induced dissociation (CID).

