
Figure 4.
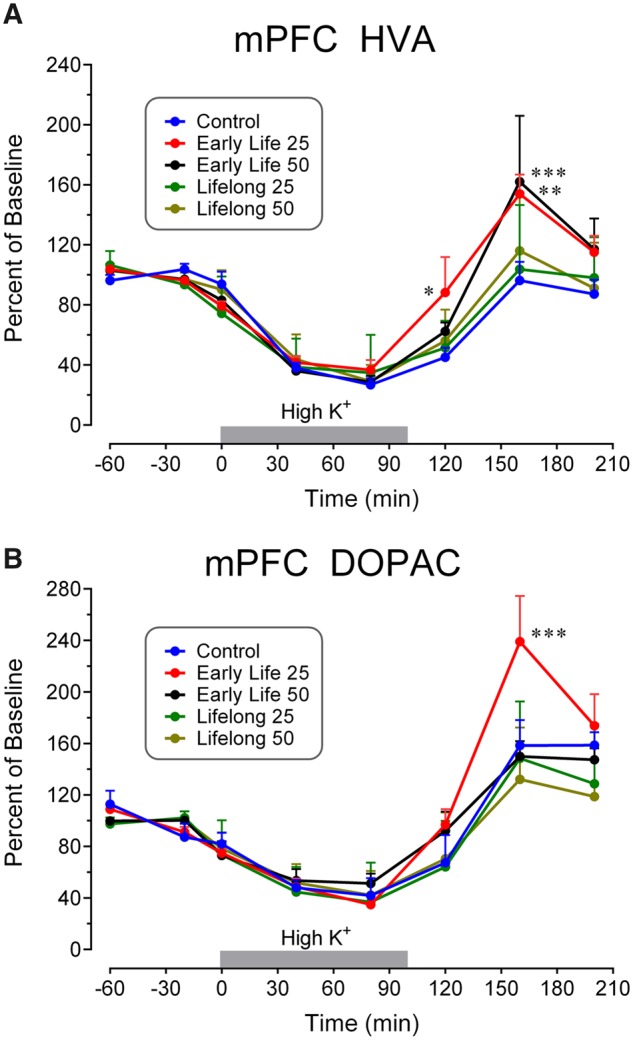
Time course of extracellular fluid concentrations of DA metabolites (A) HVA and (B) DOPAC in response to perfusion of 120 mM K+ in mPFC for the indicated time intervals (gray bars). Metabolite levels in Mn-exposed groups were increased in the time interval 80–160 min after initiation of high K+ in the Early Life groups. Note the decreases in metabolite values in all groups during high K+ administration as opposed to the increases seen with DA. Data analyses uncovered significantly enhanced values in the indicated Mn groups at the symbolized time points. Group N’s were 7 for the Control group (N = 4 for DOPAC), 12 for the Early Life 25 group, 9 for the Early Life 50 group, 10 for the Lifelong 25 group, and 11 for the Lifelong 50 group. ***p < .001, **p < .01, and *p < .05 compared with the control concentrations at the same time point.