
Figure 5.
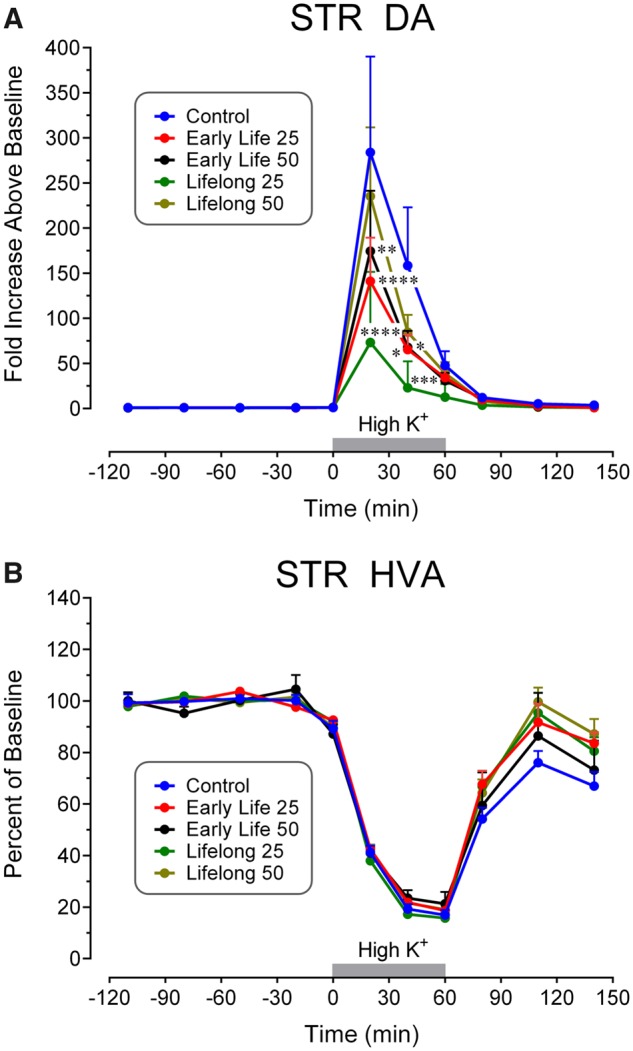
Time course of extracellular fluid concentrations of (A) DA and (B) HVA in response to perfusion of 120 mM K+ in STR for the indicated time intervals (gray bars). DA levels in Mn-exposed groups were decreased in the 0–40 min time interval depending on the group. Note the decreases in HVA values in all groups during high K+ administration as opposed to the increases seen with DA. Data analyses uncovered significantly diminished values in the indicated Mn groups at the indicated time points. Group N’s were 8 for the Control group, 12 for the Early Life 25 group, 10 for the Early Life 50 group, and 11 for the Lifelong 25 and Lifelong 50 groups. ****p < .0001, ***p < .001, **p < .01, and *p < .05 compared with the control concentrations at the same time point.