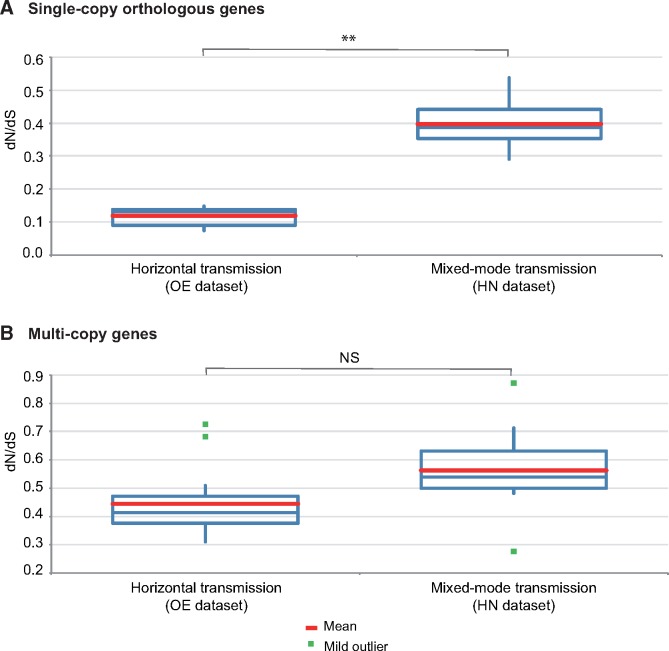
Fig. 2.
—Box plots of mean dN/dS estimates (A) for all orthologous genes identified in OE and HN data sets, based on 112,055 and 8,846 pairwise comparisons, respectively and (B) for all copies of similar genes within genomes based on 7,790 comparisons of data set OE and 64,437 of data set HN. The statistical significance of the difference between dN/dS means was assessed by unequal variance t-tests (**P < 0.01; NS = not significant; supplementary file 4, Supplementary Material online).

