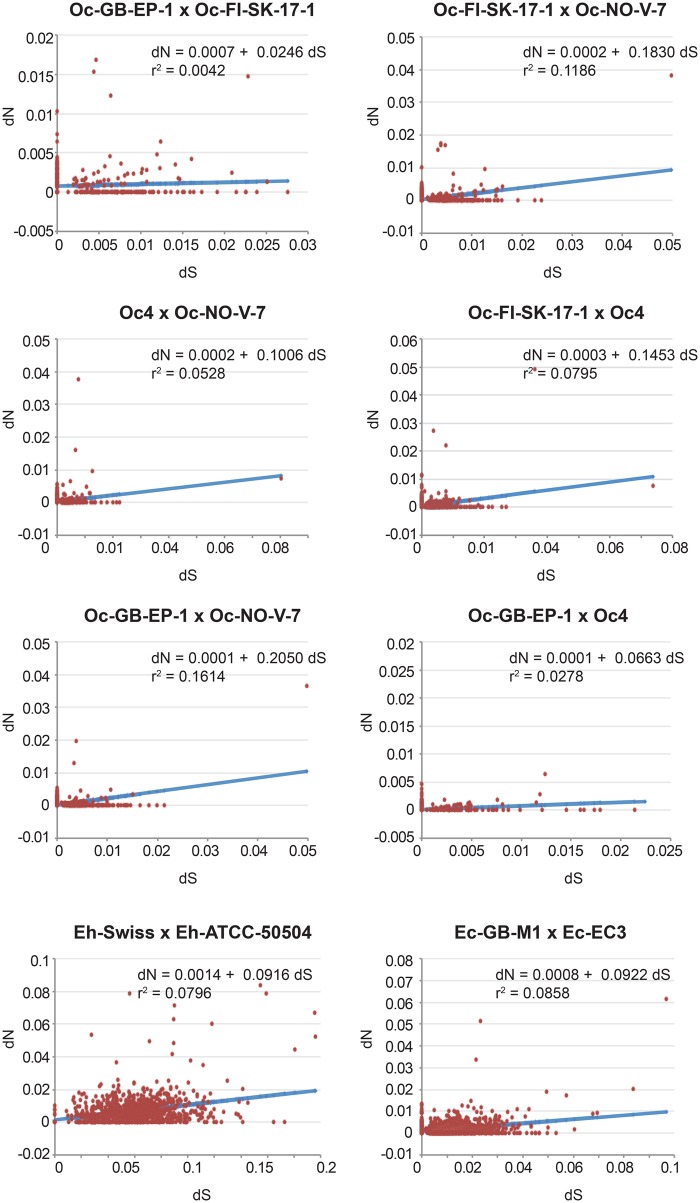
Fig. 3.
—Linear regression analyses of dN versus dS estimates for all orthologous genes identified in a subset of comparisons from the OE data set (see supplementary file 7, Supplementary Material online, for details). The regression equations describing the best fit of the dN versus dS distributions are given. Correlation coefficients are indicated. Oc = O. colligata; Eh = E. hellem; Ec = E. cuniculi.

