Figure 5.
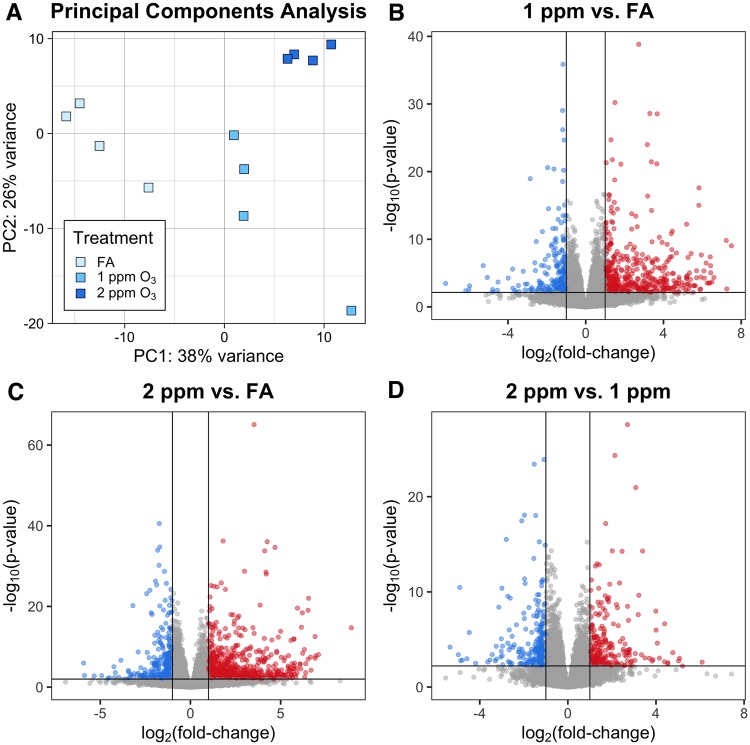
Airway macrophage (AM) gene expression is altered by O3 exposure. Gene expression in pooled AM from mice exposed to FA, 1 or 2 ppm O3. (A) Principal components analysis displays separation of AMs across all 3 treatment groups. Differential expression analysis revealed (B) 693 DEGs in 1 ppm versus FA, (C) 971 DEGs in 2 ppm versus FA, and (D) 467 DEGs in 2 versus 1 ppm (n = 4 pools per treatment group, fold-change cutoff = 2, Benjamini–Hochberg adjusted p-value < 0.05).

