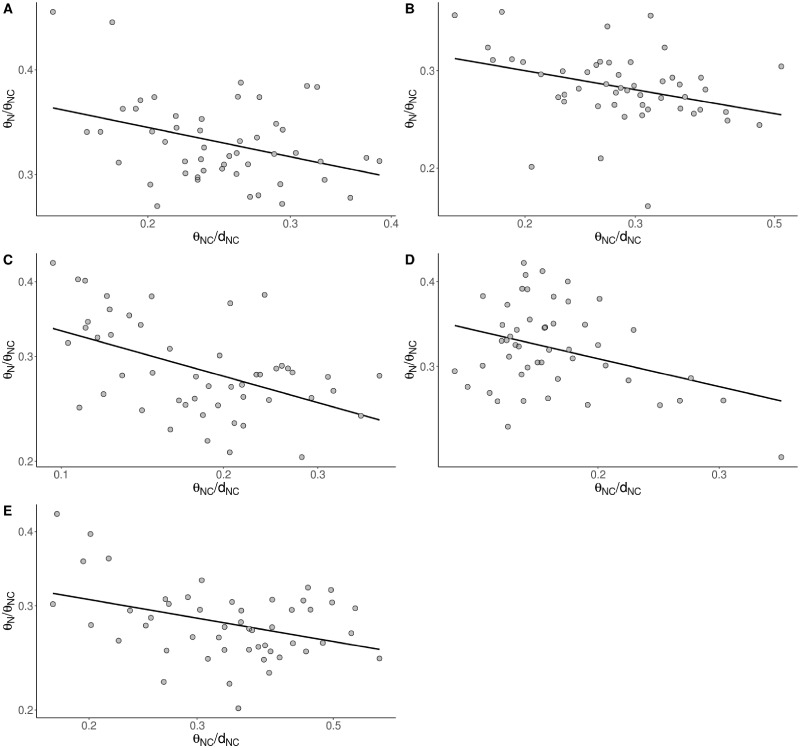
Fig. 3.
—Relationship between θN/θNC and θNC/dNC in a log–log scale for all mutations in (A) humans (P-value < 0.01), (B) Nigeria-Cameroon chimpanzees (P-value < 0.05), (C) western chimpanzees (P-value < 0.001), (D) bonobos (P-value < 0.05), and (E) gorillas (P-value < 0.01). Results grouping 50 kb windows into 50 bins by noncoding diversity.

