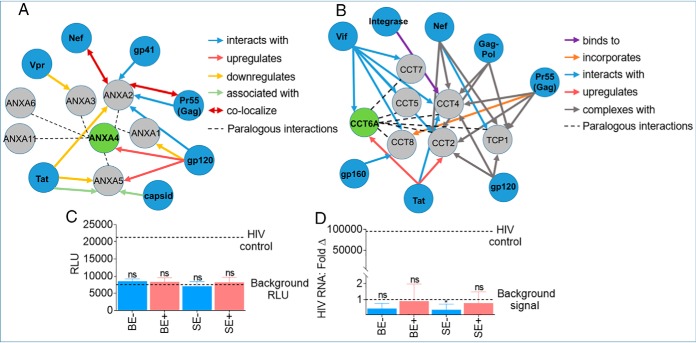
Fig. 8.
Predictive interaction between differentially present exosomal and HIV proteins. A, B, SE-ANXA4·HIV and SE-CCT6A·HIV protein-protein interaction was analyzed with the HIV·Human interaction database. C, Evaluation of HIV LTR promoter activation potential of TZM-bl cells treated with 200 μg BE and SE from HIV- (n = 3) and HIV+ groups (n = 3) for 24 h. Data are reported as the group mean (HIV- or HIV+) from individuals measured in triplicate. Error bars are S.D. Values are reported as relative light units (RLU). HIV-1 NL4.3 virus was used as positive control, and vehicle treated cells as negative control (dotted lines). D, Evaluation of HIV infection (RNA) in SUPT1 cells treated with 200 μg BE and SE from HIV- (n = 3) and HIV+ (n = 3) groups for 24 h. Data are reported as the group mean (HIV- or HIV+) from individuals measured in duplicate. Values are reported as HIV RNA fold change in reference to uninfected cells. Error bars are S.D. HIV-1 NL4.3 virus was used as positive control, and vehicle treated cells as negative control (dotted lines). Statistical significance for RLU and HIV RNA: Fold Δ was determined between each group and background RLU or background signal, respectively, by two-tailed paired Student's t test. **** = <0.0001, *** = <0.001, ** = <0.01, * = <0.05. Fold change values in reference to HIV-uninfected cells set at 1 were used for statistical analysis of HIV RNA: Fold Δ.

