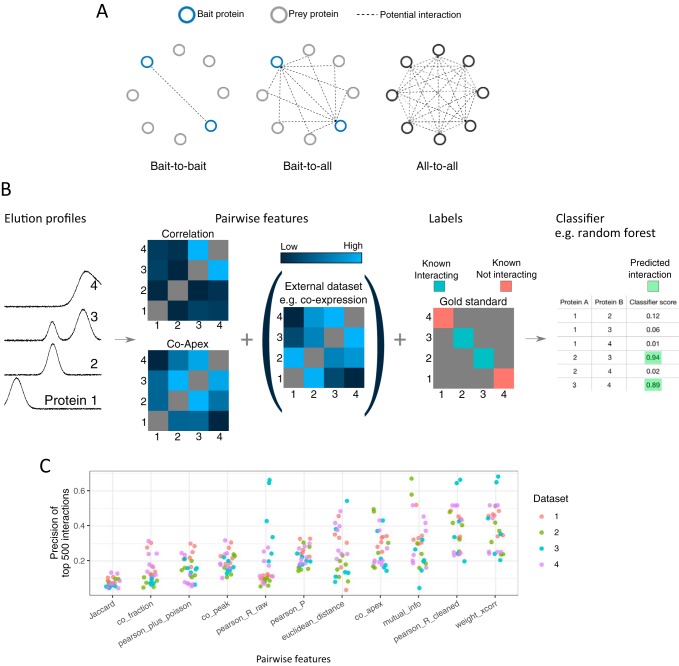
Fig. 2.
Bioinformatic analysis of co-elution data. A, Bioinformatic analysis of co-elution data is complicated by the number of potential interactions. In contrast to techniques such as Y2H that find interactions between tagged proteins (“Bait-to-bait”) or BioID (and sometimes AP-MS) that find interactions involving at least one bait protein (“Bait-to-all”), co-elution experiments have the potential to find interactions between all identified proteins in a sample (“All-to-all”). B, Schematic of classifier-based analysis of co-elution data. The strength of co-elution is quantified for every pair of proteins using multiple metrics (“features”). Features derived from external data can be included, such as co-citation or co-expression. Using a gold standard set of known complexes, a subset of the protein pairs are labeled as interacting or not-interacting. Finally, a classifier uses to the features and labels to assign every pair of profiles a classifier score, to which a threshold is applied. C, Performance of single co-elution features. Interactomes were predicted from four data sets using a single co-elution metric. Each dot represents an interactome from one replicate, and the y axis gives the precision of the 500 best-scoring interactions. Interactomes were predicted using PrInCE with default parameters (CORUM gold standard). weighted_xcorr: Weighted cross-correlation, measured with R function wccsom. pearson_R_cleaned: Pearson correlation (cleaned profiles). mutual_info: Mutual information. co_apex: Mininum number of fractions between fitted Gaussian centers. pearson_P: Pearson correlation (raw profiles) p value. pearson_R_raw: Pearson correlation (raw profiles). euclidean_distance: Euclidean distance (cleaned profiles). co_peak: Number of fractions between maximum value. pearson_plus_poisson: Pearson R (raw profiles) plus Poisson noise. co_fraction: 1 if maximum values are in the same fraction, 0 otherwise. Jaccard: Overlapping fractions in which both proteins are quantified, measured with Jaccard. Data sets: 1 Kristensen et al. 2012 (20), 2 Scott et al. 2017 (29), Carlson et al. 2019 (42), Scott et al. 2015 (78).

