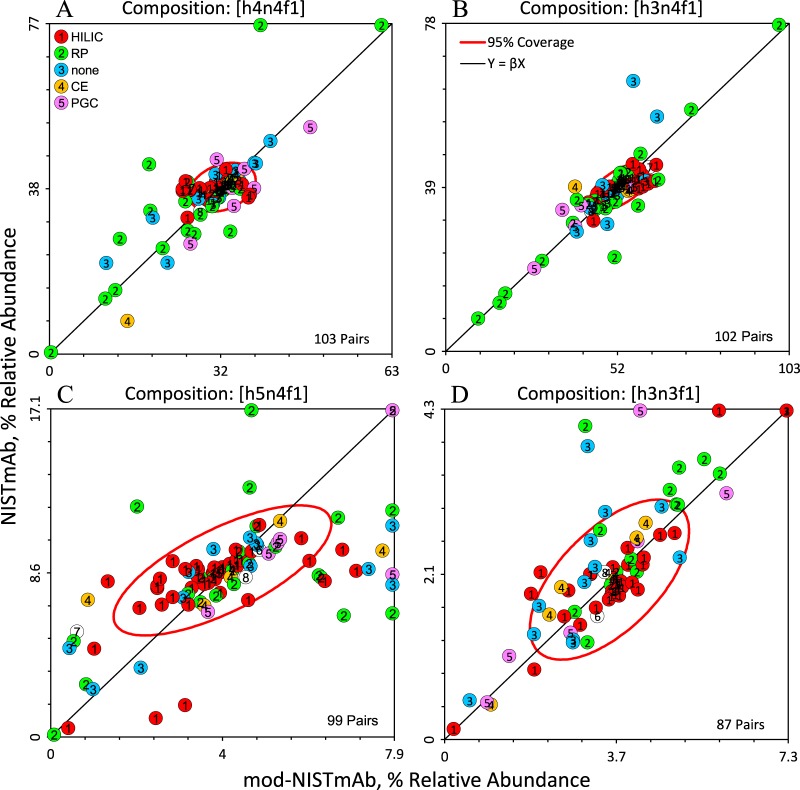
Fig. 5.
Youden two-sample plots for the four most abundant glycan compositions in NISTmAb. Each panel displays the bivariate distribution for one composition. A) [h4n4f1], B) [h3n4f1], C) [h5n4f1], and D) [h3n3f1] (see Materials and Methods for key). The panels are centered on the univariate medians and scaled to display all values from 0 to twice the median. Values that are greater than twice the median are assigned a value of twice the median. The ellipse includes about 68% of the pairs (≈ 1 SD). The diagonal line represents the expected relationship when measurement systems have the same bias for both samples. Each symbol represents the (mod-NISTmAb, NISTmAb) pair for one data set. Symbols are coded and labeled by separation technique.

