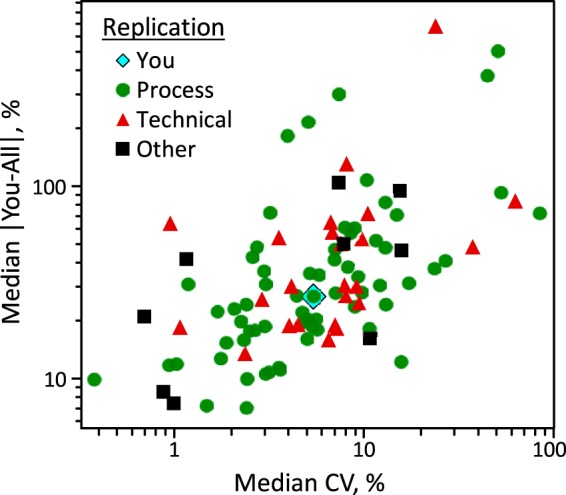
Fig. 7.

Scatterplot of the closeness to consensus of the reported values as a function of measurement repeatability estimated as CV. The symbols are coded by the user-stated nature of the reported replicates. The plot shows the data point, in blue diamond, of one data set.
