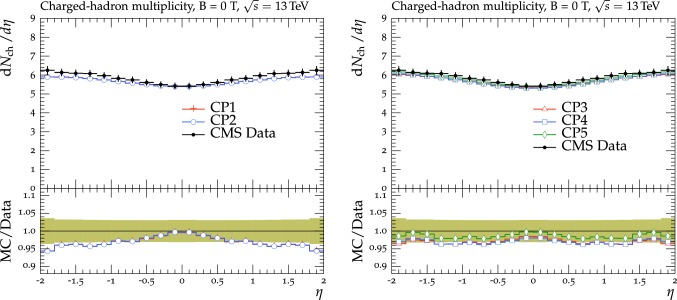
Fig. 10.
The pseudorapidity distribution of charged hadrons measured in for an inclusive selection in inelastic proton-proton collisions, with zero magnetic field strength (B = 0 T), from the CMS analysis [18]. The data are compared with the CMS pythia8 LO-PDF tunes CP1 and CP2 (left), and with the CMS pythia8 NLO-PDF tune CP3 and the CMS pythia8 NNLO-PDF tunes CP4 and CP5 (right). The ratios of simulations to the data (MC/Data) are also shown, where the shaded band indicates the total experimental uncertainty in the data. Vertical lines drawn on the data points refer to the total uncertainty in the data. Vertical lines drawn on the MC points refer to the statistical uncertainty in the predictions. Horizontal bars indicate the associated bin width

