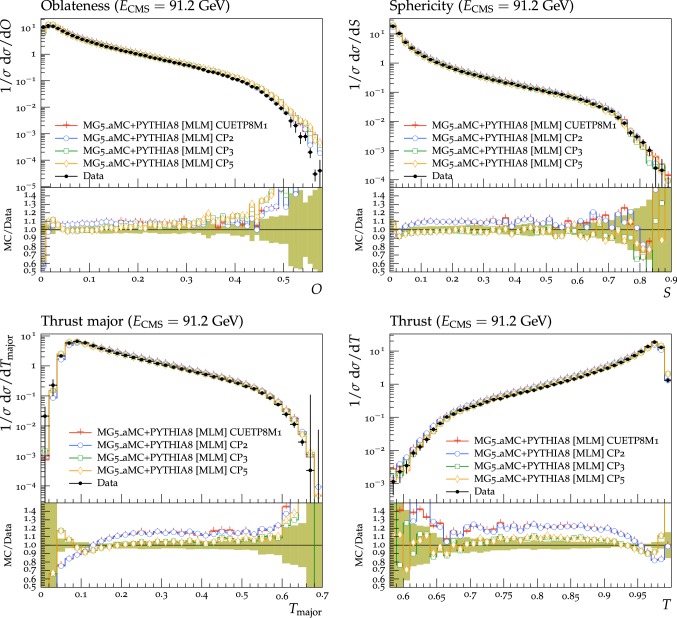
Fig. 11.
The normalized cross sections as a function of event-shape variables, oblateness (upper left), sphericity (upper right), thrust (lower left), and thrust major (lower right) from the ALEPH analysis [45], compared with the predictions by mg5_amc pythia8 with –MLM merging, for tunes CP2, CP3, and CP5. The ratio of the simulations to the data (MC/Data) is also shown, where the shaded band indicates the total experimental uncertainty in the data. Vertical lines drawn on the data points refer to the total uncertainty in the data. Vertical lines drawn on the MC points refer to the statistical uncertainty in the predictions. Horizontal bars indicate the associated bin width

