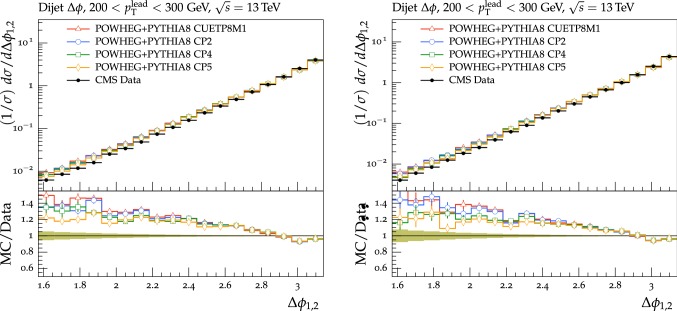
Fig. 17.
The azimuthal difference between the leading two jets with in dijet events with leading-jet transverse momentum in the range (left) and (right) , from the CMS analysis [57]. The jets are reconstructed using the anti- jet finding algorithm [58, 59] with a distance parameter of 0.4. The data are compared with predictions of the NLO dijet ME calculation from powheg, interfaced to the pythia8 tunes CUETP8M1, CP2, CP4, and CP5. Tunes CP1 and CP3 are not shown in the plot but present a similar behavior as tunes CP2 and CP4. The ratios of simulations to the data (MC/Data) are also shown, where the shaded band indicates the total experimental uncertainty in the data. Vertical lines drawn on the data points refer to the total uncertainty in the data. Vertical lines drawn on the MC points refer to the statistical uncertainty in the predictions. Horizontal bars indicate the associated bin width

