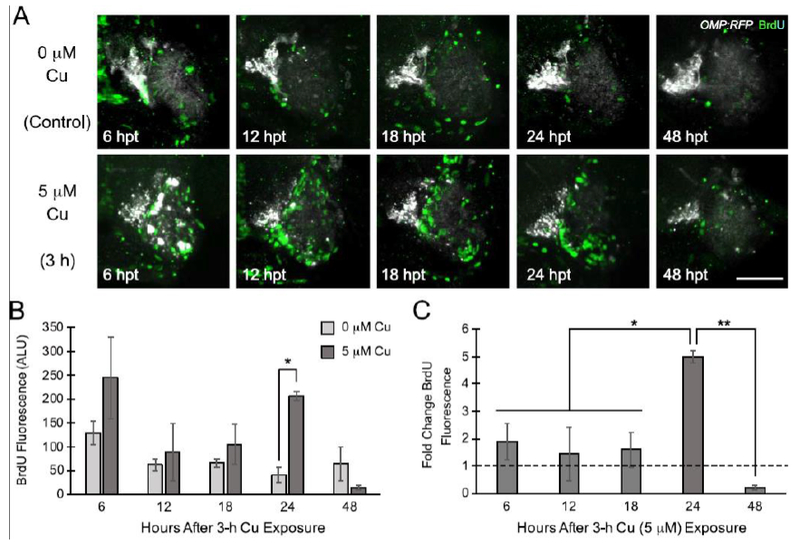
Figure 5:

Cell proliferation increases approximately 24 hours after Cu-induced OSN injury. A. Representative confocal images of OMP:RFP transgenic fish showing BrdU-labeled cells at different times after initial Cu exposure (e.g. 5 μM Cu exposure for 3 h). Scale bar = 50 μM. B. Semi-quantitative analysis of BrdU fluorescence from confocal images normalized to the thresholded area of imaging (graphed as arbitrary light units; ALU). C. Graph showing BrdU incorporation of Cu-exposed larvae as fold-changes over the time-matched unexposed controls. Error bars = ± SE; n=3-4 fish per sample. Asterisks indicate statistically significant change at *p<0.05 and **p<0.01 significance levels.
