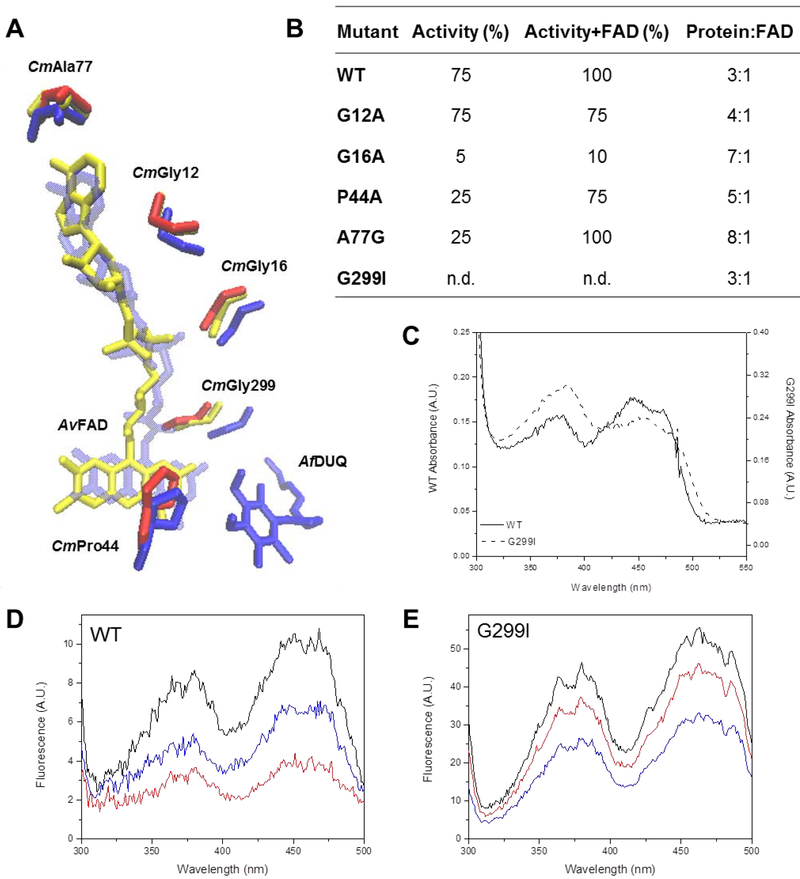
Figure 4. Residues involved in the putative FAD binding site.
(A) Overlapped residues from structures from A. vinosum FCSD (yellow), A. ferrooxidans (blue) are compared to those from the C. maquilingensis SQR model (red). DUQ: decylubiquinone. (B) WT and mutants were assayed for activity in the absence and presence of additional FAD as indicated. The FAD content of each protein was quantified after extraction by TCA treatment. 100% activity corresponds to 0.76 ± 0.03 μM of reduced DUQ per μM protein−1 per sec−1. Data are expressed as average ± SD of at least three independent experiments. Standard deviations for all the activity values were lower than 10 %. (C) FAD UV-Visible spectrum of the G299I mutant compared to WT. (D) WT and (E) G299I fluorescence excitation spectra before (black) and after addition of 200 μM of Na2S (red) and 200 μM of DUQ (blue).

