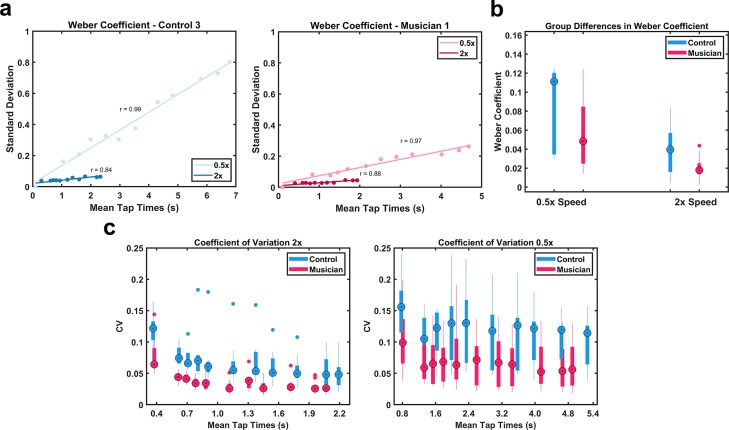
Fig 4. Analysis of variance at scaled times.
(A) Example of the Weber Coefficient for a musician and a control subject at the 0.5x and 2x speeds. (B) Analysis of the Weber coefficients revealed main effects of group (Musicians x Controls) and speed (0.5x versus 2x). (C) The coefficient of variation (the ratio of standard deviation and mean) across all taps was significantly lower for the musician group at both speeds.

