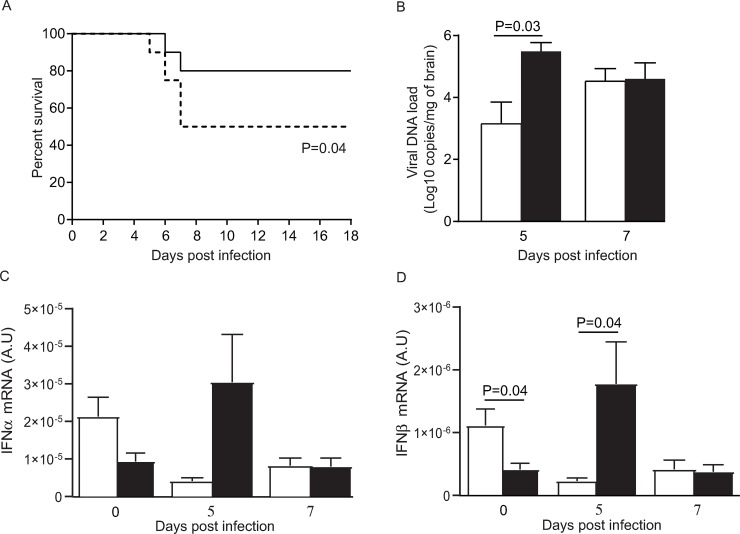
Fig 4. Impact of MBL deficiency in HSV-1 infected mice.
A. Survival rates of WT and MBL-null (dotted line) mice. Results represent combined data from two separate experiments with 10 WT and 10 MBL-null mice each. Statistical analyses were performed using a log-rank (Mantel-Cox) test. B. Viral load in brain homogenates of WT (white) and MBL-null (black) mice. Results are mean ± standard error of the mean of 3–5 mice per group and per time-point. Statistical analyses were performed using an unpaired Student t-test. C, D. IFNα (C) and IFNβ (D) mRNA levels normalized to those of 18S mRNA, in brain homogenates of WT (white) and MBL-null (black) mice on days 0, 5 and 7 post-infection. Results represent the mean ± standard error of the mean of 3–5 mice per group and per time point. Statistical analyses were performed using an unpaired Student t-test. A.U. stands for arbitrary units.

