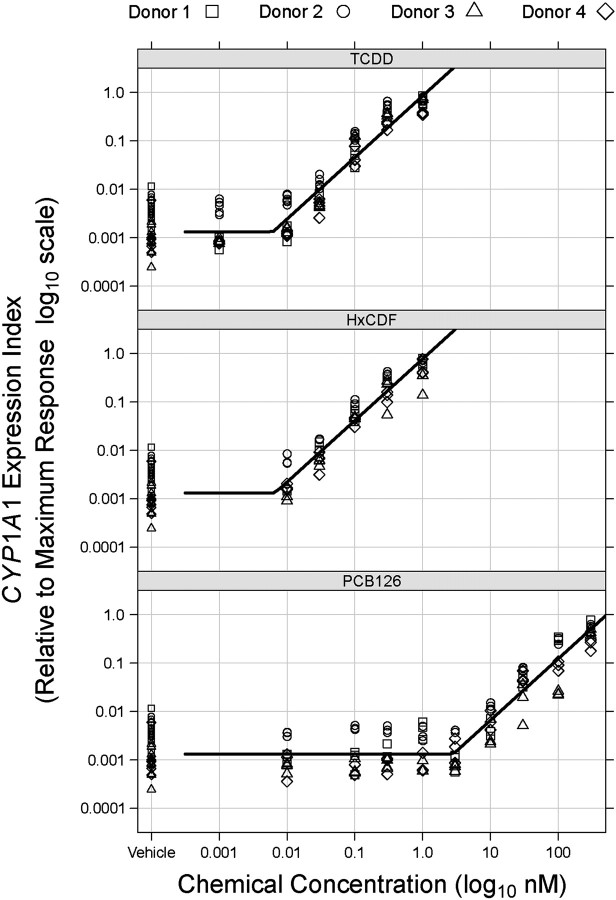
FIG. 4.
Models of apparent population thresholds for NHEKs treated with TCDD, HxCDF, and PCB 126. Relative CYP1A1 mRNA increases from each of the four donors treated with TCDD (upper panel), HxCDF (middle panel), and PCB 126 (lower panel) were plotted and analyzed as described in Materials and Methods section. Each point in the graphs represents an individual sample, and curves are the population-level response predicted by the threshold model. Note that both axes are log10 transformed.

