. 2019 Dec 19;8:e49708. doi: 10.7554/eLife.49708

Figure 5. GC biases in the targets of various RNA decay factors, translation regulators and miRNAs.

(A) GC content biases in the targets of various RBPs. The targets of the indicated factors were defined using CLIP experiments or motif analysis (see Materials and methods). The boxplots represent the distribution of the GC content of their gene. The distribution for all mRNAs is presented for comparison (in gray) and the red dashed line indicates its median value. (B) Heatmap representation of the different factors depending on the behavior of their mRNA targets in the different datasets. The lines were ordered by increasing GC content, and the columns as in Figure 4E. (C) GC content biases in the targets of various AGO proteins and miRNAs. The AGO targets (in yellow) were defined using CLIP experiments and the miRNAs targets (in violet) using miRTarbase. The data are represented as in (A). (D) Heatmap representation of AGO and miRNAs depending on the behavior of their mRNA targets in the different datasets. The data were represented as in (B), using the same color code.

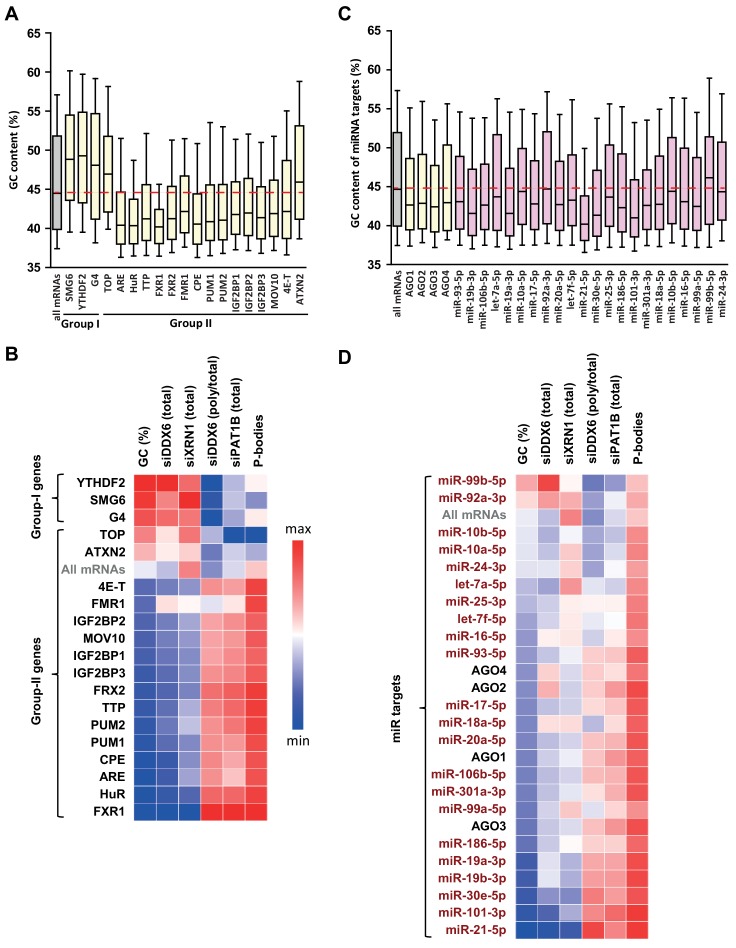
Figure 5.

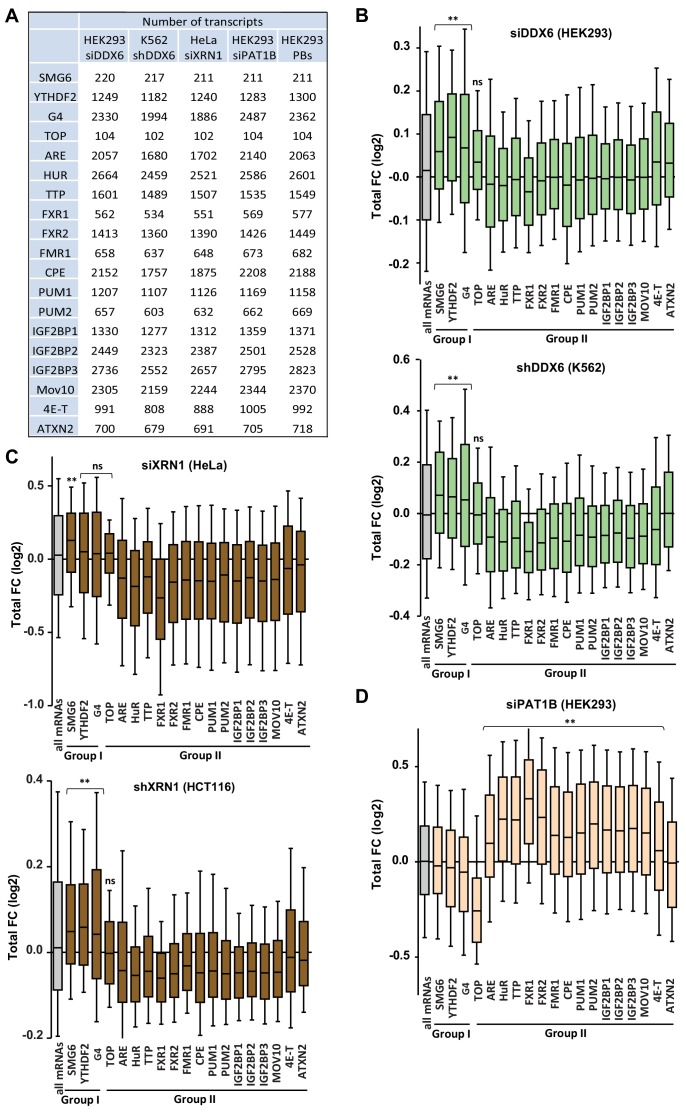
Figure 5—figure supplement 1. Targets of group I and II regulators (part I).

Figure 5—figure supplement 1.

(A) Number of transcripts in the mRNA subsets analyzed in (B–D) and in Figure 5A,B, Figure 5—figure supplement 2A–D and Figure 5—figure supplement 4. (B) Sensitivity of the different mRNA subsets to DDX6 silencing in HEK293 (upper panel) and K562 cells (lower panel). The behavior of all mRNAs is shown for comparison (in gray). Only the targets of group I factorsaccumulated following DDX6 depletion. While the presented analysis uses the YTHDF2 targets reported in Vindry et al. (2019), the same pattern was observed using the targets reported in Ozgur et al. (2010). (C) Sensitivity of the different mRNA subsets to XRN1 silencing in HeLa (upper panel) and HCT116 cells (lower panel). Only the targets of group I factors accumulated following XRN1 depletion in HCT116 cells, and only SMG6 targets did so in HeLa cells. (D) Sensitivity of the different mRNA subsets to PAT1B silencing in HEK293 cells. Only the targets of group II factors accumulated following PAT1B depletion, except ATXN2. Two-tail Mann-Whitney test was performed with respect to all mRNAs. **, p<0.0001; ns, non-significant.
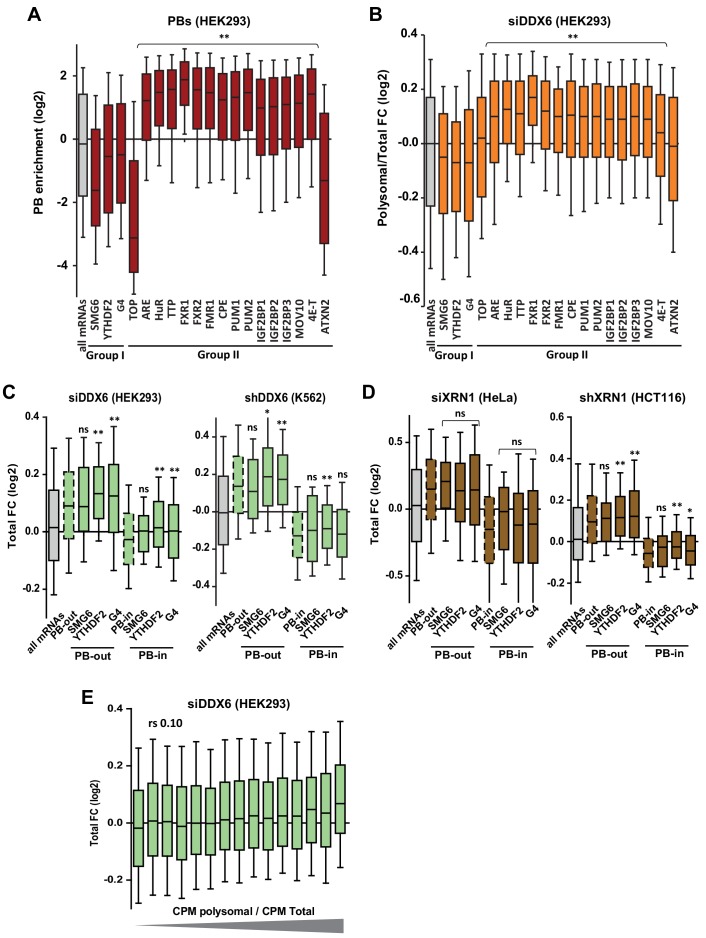
Figure 5—figure supplement 2. Targets of group I and II regulators (part II).

Figure 5—figure supplement 2.

(A) PB localization of the different mRNA subsets. Only the targets of group II factors were enriched in PBs, except ATXN2. Note also that SMG6 targets and TOP mRNAs were particularly excluded from PBs. (B) Sensitivity of the different mRNA subsets to DDX6 silencing in HEK293 in terms of translation rate(polysomal/total mRNA ratio). Only the targets of group II factors were translationally derepressed, except ATXN2. Two-tail Mann-Whitney test was performed with respect to all mRNAs. **, p<0.0001. (C, D) The targets of group I regulators were stabilized after DDX6 (C) and XRN1 (D) silencing mostly like other PB-excluded mRNAs. The same analysis as in Figure 5—figure supplement 1B and C was conducted separately on PB-excluded (PB-out) and PB-enriched (PB-in) mRNAs. The distribution of all mRNAs (in gray), all PB-out and all PB-in mRNAs (dashed boxes) are shown for comparison. Two-tail Mann-Whitney test was performed with respect to cognate PB-out or PB-in mRNAs. **, p<0.0001; *, p=0.006 for (C) and 0.02 for (D); ns, non-significant. (E) DDX6-dependent mRNA decay does not correlate with polysome engagement. The fraction of mRNAs in polysomes (polysomal/total cpm) was calculated using the RNA-Seq data from control HEK293 cells. Transcripts were subdivided into 15 bins (1000 transcripts each) of increasing value. The boxplot represents their fold-change (FC) distribution in total RNA following DDX6 silencing.
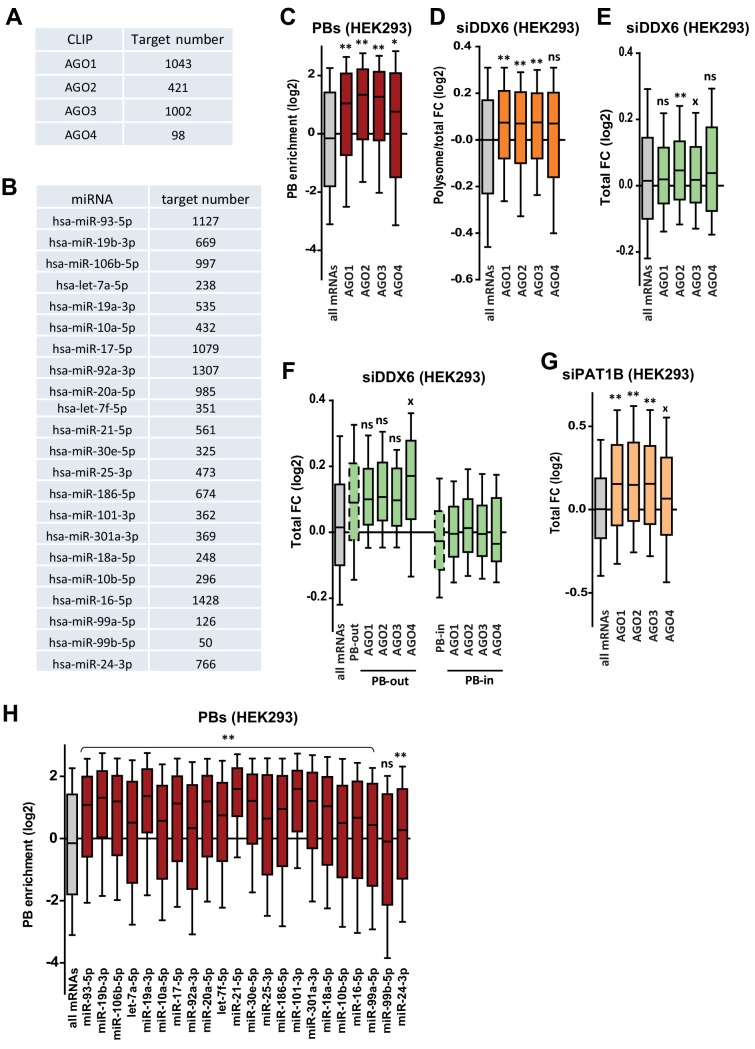
Figure 5—figure supplement 3. Targets of the miRNA pathway.

Figure 5—figure supplement 3.

(A,B) Number of AGO targets (A) and miRNA targets (B) analyzed in (C–H) and in Figure 5C,D. (C–E) AGO targets are enriched in PBs (C), translationally derepressed (D) and little or not stabilized (E) following DDX6 silencing. Two-tail Mann-Whitney test was performed with respect to all mRNAs. **, p<0.0001; *, p=0.002, x, p=0.04; ns, non-significant. (F) AGO targets excluded from PBs accumulate following DDX6 silencing like other PB-excluded transcripts. The analysis was performed as in Figure 5—figure supplement 2C. Two-tail Mann-Whitney test was performed with respect to cognate PB-out or PB-in mRNAs. x, p=0.04; ns, non-significant. (G) AGO targets accumulate following PAT1B silencing. Two-tail Mann-Whitney test was performed with respect to all mRNAs. **, p<0.0001; x, p=0.04. (H) The extent of PB enrichment of miRNA targets depends on the miRNA. Two-tail Mann-Whitney test was performed with respect to all mRNAs. **, p<0.0001; ns, non-significant.
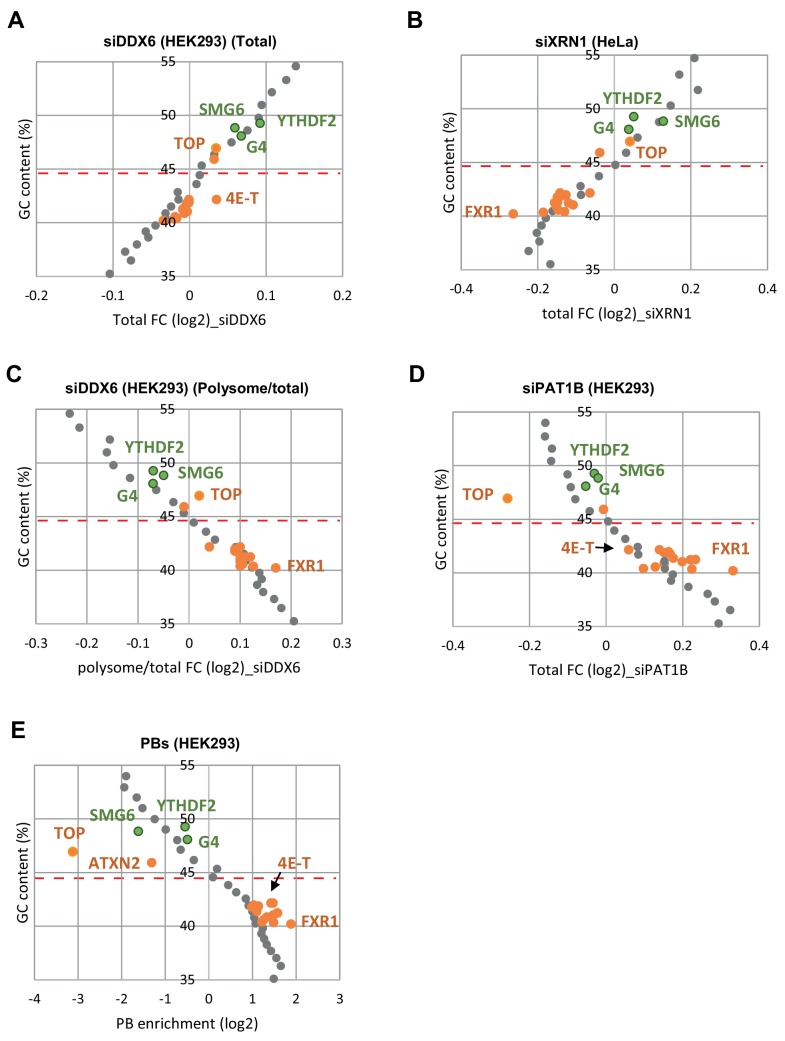
Figure 5—figure supplement 4. Targets of the group I and II regulators behave like mRNAs of similar GC content.

Figure 5—figure supplement 4.

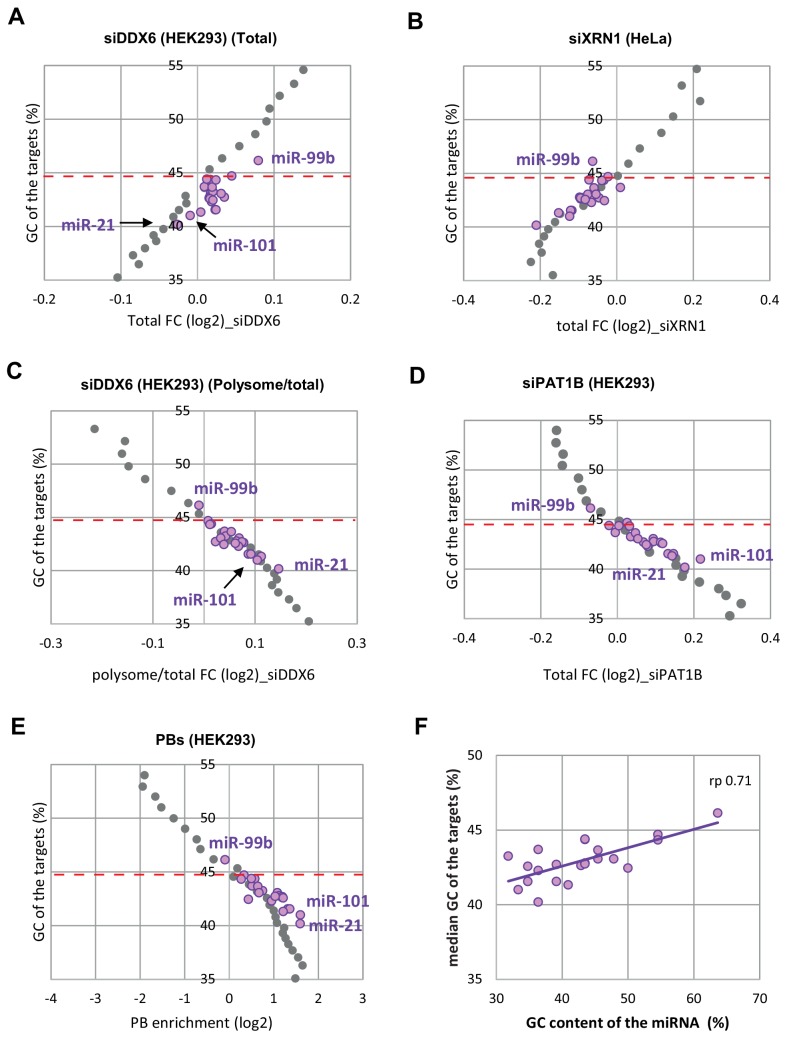
(A–E) The whole transcriptome was binned depending on its GC content (bin size of 500 mRNAs). The median GC content of each bin was represented as a function of its median fold-change in the various datasets (in gray). The same analysis was performed for the targets of group I (in green) and II (in orange) regulators, and superimposed to the graphs. The dashed line indicates the median GC content for all mRNAs. Overall, in all datasets, the targets of the different regulators behave similarly to mRNAs of same GC content. For figure clarity, only the few regulators leading to distinct behaviors were indicated.
Figure 5—figure supplement 5. miRNA targets behave like mRNAs of similar GC content.

Figure 5—figure supplement 5.

(A–E) The analysis was conducted as in Figure 5—figure supplement 4. Overall, the targets of the different miRNAs behave similarly to mRNAs of same GC content. (F) The GC content of miRNA targets correlates with the GC content of the miRNA itself. rp, Pearson correlation coefficient.