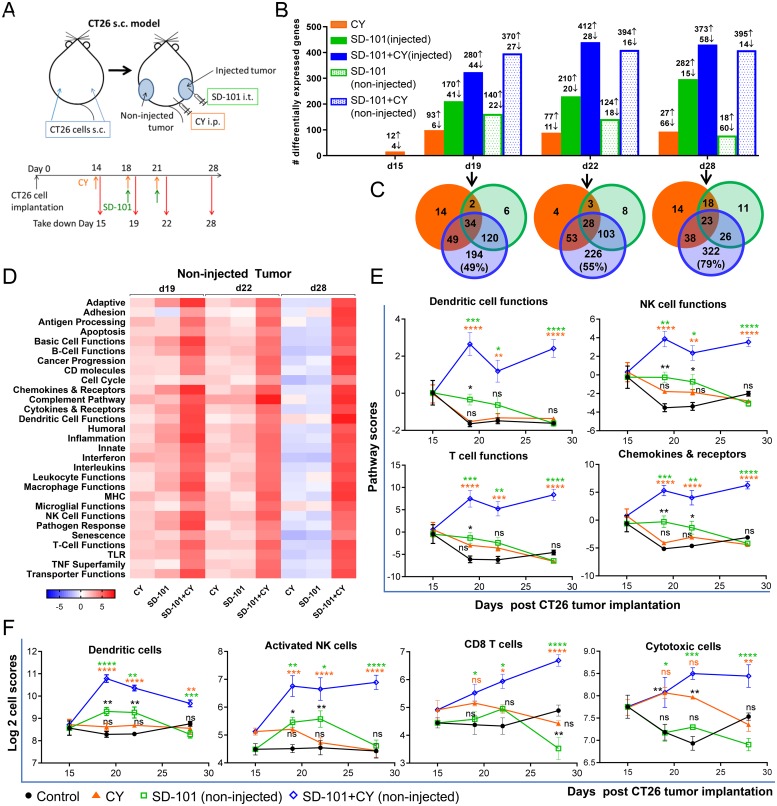
Figure 4. Gene expression changes to the TME demonstrate sequential development of innate and adaptive immune responses.
(A) CT26 cells were implanted s.c. in both flanks (n=4-5/group). CY (40 mg/kg) was given i.p. and SD-101 (50 μg/injection) was injected into the right flank (injected site). RNA was extracted from tumors as indicated in the experimental schema (A). (B) Number of differentially expressed (DE) genes in the treatment groups that exhibit a log2 fold change >0.6 (>1.5 fold change) and P<0.05 compared to control group at the indicated time points. (C) Venn diagrams of the number of overlapping DE genes of the non-injected tumors between treatment conditions. (D) Heatmap of directed global significance scores (non-injected tumor), which display the extent to which a gene sets’ genes are up or down-regulated with the treatments relative to control at that time point. (E) Pathway scores (non-injected tumor), which summarize the data from a pathway’s genes with a single score, of select functional pathways. (F) Cell type scores (non-injected tumor), which measure the intratumoral abundance of immune cells using specific gene signatures. Data are mean ± SEM, * compared with control, * compared with SD-101, * compared with CY. * indicates P ≤ 0.05, ** P ≤ 0.01, *** P ≤ 0.001, and **** P ≤ 0.0001.

