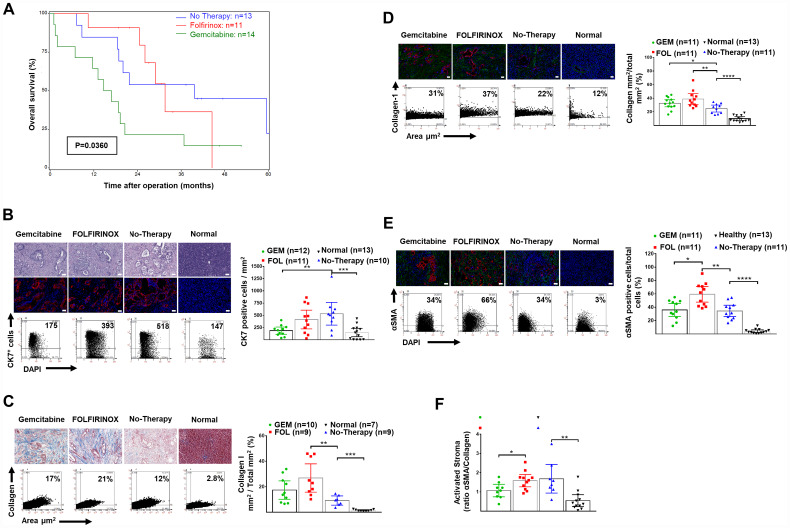
Figure 1. Overall survival and human pancreatic normal tissue and cancer stroma: H&E, CK7+ cells and expression of collagen-1 and αSMA.
(A) Overall survival after resection and neoadjuvant FOLFIRINOX or gemcitabine-based chemotherapy in patients presenting with borderline or non-resectable pancreatic cancer. The median (95% confidence interval) survival was 31.6 (24.5–44.5) months after FOLFIRINOX (n = 11) versus 15.8 (2.0–20.5) months after gemcitabine-based therapy (n = 13) (p = 0.039). (B) Representative H&E stained tissues (top), and IF (bottom) for DAPI (blue) and CK-7+ tumor cells (red), as well as representative FACS-like co-expression scattergrams and quantitation of CK-7+ cells per area in mm2 are blotted as mean with 95% CI as shown in Table 2. (C) Representative trichrome stained tissues for collagen-1, as well as representative FACS-like co-expression scattergrams and quantitation of collagen-1 expression per area mm2 are blotted as mean with 95% CI as shown in Table 2. (D) Representative IF stained tissues for collagen-1 (green), DAPI (blue) and CK-7+ tumor cells (red), as well as representative FACS-like co-expression scattergrams and quantitation of collagen-1 expression per area mm2 are blotted as mean with 95% CI as shown in Table 2. (E) Representative IF stained tissues for αSMA (green), DAPI (blue) and CK-7+ tumor cells (red), as well as representative FACS-like co-expression scattergrams and quantitation of αSMA and are blotted as mean with 95% CI as shown in Table 2. (F) The mean (95% CI) activated stromal index (ratio of αSMA to collagen-1) by group. Human tissue scale bar = 20 μm, 20× objective. * P < 0.05, ** P < 0.01, *** P < 0.001, **** P < 0.0001.

